
Page 106 - Theoretical and Practical Interpretation of Investment Attractiveness
P. 106
In this regard, all summary indicators are grouped into five assessment blocks that
describe the innovation potential of the region (Table 3.1.4).
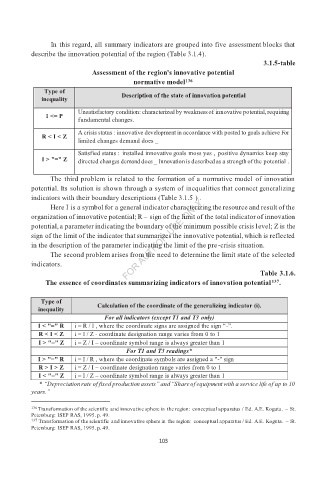
3.1.5-table
Assessment of the region's innovative potential
normative model 136
Type of
Description of the state of innovation potential
inequality
Unsatisfactory condition: characterized by weakness of innovative potential, requiring
I <= P
fundamental changes.
A crisis status : innovative development in accordance with posted to goals achieve For
R < I < Z
limited changes demand does _
Satisfied status : installed innovative goals moss yes , positive dynamics keep stay
I > "=" Z directed changes demand does _ Innovation is described as a strength of the potential .
The third problem is related to the formation of a normative model of innovation
potential. Its solution is shown through a system of inequalities that connect generalizing
indicators with their boundary descriptions (Table 3.1.5 ) .
Here I is a symbol for a general indicator characterizing the resource and result of the
organization of innovative potential; R – sign of the limit of the total indicator of innovation
potential, a parameter indicating the boundary of the minimum possible crisis level; Z is the
sign of the limit of the indicator that summarizes the innovative potential, which is reflected
in the description of the parameter indicating the limit of the pre-crisis situation.
The second problem arises from the need to determine the limit state of the selected
indicators.
Table 3.1.6.
The essence of coordinates summarizing indicators of innovation potential 137 .
Type of
Calculation of the coordinate of the generalizing indicator (i).
inequality
For all indicators (except T1 and T3 only)
I < "=" R i = R / I , where the coordinate signs are assigned the sign “-”.
R < I < Z i = I / Z - coordinate designation range varies from 0 to 1
I > "=" Z i = Z / I – coordinate symbol range is always greater than 1
For T1 and T3 readings*
I > "=" R i = I / R , where the coordinate symbols are assigned a "-" sign
R > I > Z i = Z / I – coordinate designation range varies from 0 to 1
I < "=" Z i = I / Z – coordinate symbol range is always greater than 1
* “Depreciation rate of fixed production assets” and “Share of equipment with a service life of up to 10
years.”
136 Transformation of the scientific and innovative sphere in the region: conceptual apparatus / Ed. A.E. Koguta. – St.
Petersburg: ISEP RAS, 1995. p. 49.
137 Transformation of the scientific and innovative sphere in the region: conceptual apparatus / Ed. A.E. Koguta. – St.
Petersburg: ISEP RAS, 1995. p. 49.
103