
Page 188 - Theoretical and Practical Interpretation of Investment Attractiveness
P. 188
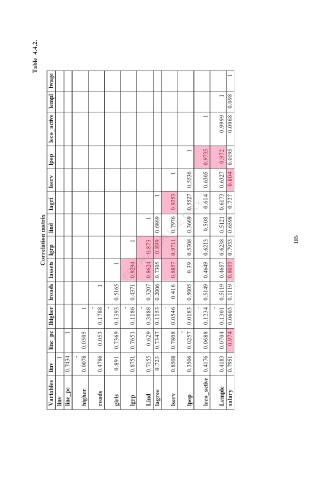
Table  4.4.2.


               lwage                                               1  1

               leco_active lempl                                           1     0.9999  0.0968 0.098


                                                   1


               lpop                                    0.9735   0.972   0.0195


                                               1

               lserv                                   0.5536   0.804
                                          1            0.614 0.6305   0.6173 0.6327
               lagri                               1   0.9253   0.727
             Correlation matrix   lind  lassets lgrp                                           1       1   0.9294   0.873   0.8624   0.6869   0.899   0.7976   0.9711   0.8857   0.39 0.5308 0.3669 0.5527   0.508   0.6213   0.5121   0.6238   0.7933 0.6598   0.8033   185
               lhigher lroads                           1   -      1   0.1788   -  0.1393 0.5165   -  0.1186 0.4371   -  0.3888 0.3207  0.7347 0.1153 0.2006 0.7305   -  0.0546 0.416   0.0257 0.0183 0.5005   - 0.1234 0.5149 0.4649   - 0.1301 0.5119 0.4657   0.0603 0.1119


               linc_pc               1   0.053  0.629  -     0.974


                 1   -  0.0078 0.0505   0.891 0.7369   0.8751 0.7651   0.8508 0.7808   0.4176 0.0688   0.4183 0.0704
               linv   0.7434   0.4786   0.7155  0.723   0.3506   0.7951

               Variables   linv   linc_pc   higher   roads   girls   lgrp   Lind   lagree   lserv   lpop   leco_active   Lemple   salary