
Page 191 - Theoretical and Practical Interpretation of Investment Attractiveness
P. 191
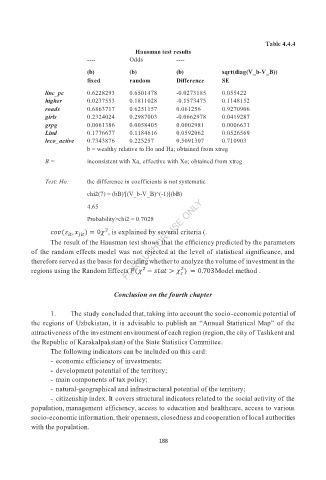
Table 4.4.4
Hausman test results
---- Odds ----
(b) (b) (b) sqrt(diag(V_b-V_B))
fixed random Difference SE
linc_pc 0.6228293 0.6501478 -0.0273185 0.055422
higher 0.0237553 0.1811028 -0.1573475 0.1148152
roads 0.6863717 0.6251157 0.061256 0.9270906
girls 0.2324024 0.2987003 -0.0662978 0.0419287
grpg 0.0061386 0.0058405 0.0002981 0.0006631
Lind 0.1776677 0.1184616 0.0592062 0.0526569
leco_active 0.7343876 0.225257 0.5091307 0.710903
b = wealthy relative to Ho and Ha; obtained from xtreg
B = inconsistent with Xa, effective with Xo; obtained from xtreg
Test: Ho: the difference in coefficients is not systematic
chi2(7) = (bB)'[(V_b-V_B)^(-1)](bB)
4.65
Probability>chi2 = 0.7028
ଶ
ܿݒሺߝ ǡݔ ሻൌ Ͳ߯ , is explained by several criteria (.
௧ ௧
The result of the Hausman test shows that the efficiency predicted by the parameters
of the random effects model was not rejected at the level of statistical significance, and
therefore served as the basis for deciding whether to analyze the volume of investment in the
ଶ ଶ
regions using the Random Effects ܲሺ߯ െݏݐܽݐ ߯ ሻ ൌ ͲǤͲ͵Model method .
Conclusion on the fourth chapter
1. The study concluded that, taking into account the socio-economic potential of
the regions of Uzbekistan, it is advisable to publish an “Annual Statistical Map” of the
attractiveness of the investment environment of each region (region, the city of Tashkent and
the Republic of Karakalpakstan) of the State Statistics Committee.
The following indicators can be included on this card:
- economic efficiency of investments;
- development potential of the territory;
- main components of tax policy;
- natural-geographical and infrastructural potential of the territory;
- citizenship index. It covers structural indicators related to the social activity of the
population, management efficiency, access to education and healthcare, access to various
socio-economic information, their openness, closedness and cooperation of local authorities
with the population.
188