
Page 189 - Theoretical and Practical Interpretation of Investment Attractiveness
P. 189
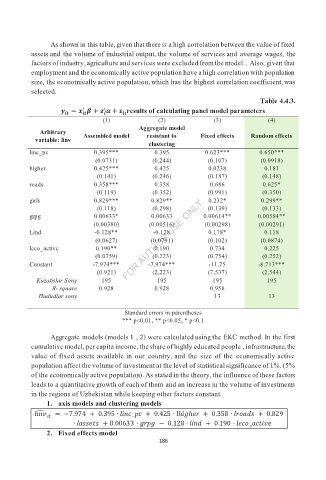
As shown in this table, given that there is a high correlation between the value of fixed
assets and the volume of industrial output, the volume of services and average wages, the
factors of industry, agriculture and services were excluded from the model. . Also, given that
employment and the economically active population have a high correlation with population
size, the economically active population, which has the highest correlation coefficient, was
selected.
Table 4.4.3.
ᇱ ᇱ
࢟ ൌ࢞ ࢼ ࢠ ࢻ ઽ results of calculating panel model parameters
࢚
࢚
ܑܜ
(1) (2) (3) (4)
Aggregate model
Arbitrary
Assembled model resistant to Fixed effects Random effects
variable: linv
clustering
linc_pc 0.395*** 0.395 0.623*** 0.650***
(0.0731) (0.244) (0.107) (0.0918)
higher 0.425*** 0.425 0.0238 0.181
(0.141) (0.246) (0.187) (0.148)
roads 0.358*** 0.358 0.686 0.625*
(0.119) (0.352) (0.991) (0.350)
girls 0.829*** 0.829** 0.232* 0.299**
(0.118) (0.298) (0.139) (0.133)
grpg 0.00633* 0.00633 0.00614** 0.00584**
(0.00380) (0.00516) (0.00298) (0.00291)
Lind -0.128** -0.128 0.178* 0.118
(0.0627) (0.0791) (0.102) (0.0874)
leco_active 0.190** 0.190 0.734 0.225
(0.0759) (0.223) (0.754) (0.252)
Constant -7.974*** -7.974*** -11.75 -8.713***
(0.921) (2,223) (7,537) (2,544)
Kuzatislar Sony 195 195 195 195
R- square 0.928 0.928 0.958
Hududlar sony 13 13
Standard errors in parentheses
*** p<0.01, ** p<0.05, * p<0.1
Aggregate models (models 1 , 2) were calculated using the EKC method. In the first
cumulative model, per capita income, the share of highly educated people , infrastructure, the
value of fixed assets available in our country, and the size of the economically active
population affect the volume of investment at the level of statistical significance of 1%. (5%
of the economically active population). As stated in the theory, the influence of these factors
leads to a quantitative growth of each of them and an increase in the volume of investments
in the regions of Uzbekistan while keeping other factors constant.
1. axis models and clustering models
݈ଓ݊ݒ ൌ െǤͻͶ ͲǤ͵ͻͷ ή ̴݈݅݊ܿܿ ͲǤͶʹͷ ή ݈݄݄݅݃݁ݎ ͲǤ͵ͷͺ ή ݈ݎܽ݀ݏ ͲǤͺʹͻ
௧
ή ݈ܽݏݏ݁ݐݏ ͲǤͲͲ͵͵ ή ݃ݎ݃ െ ͲǤͳʹͺ ή ݈݅݊݀ ͲǤͳͻͲ ή ̴݈݁ܿܽܿݐ݅ݒ݁
2. Fixed effects model
186