
Page 451 - NGTU_paper_withoutVideo
P. 451
Modern Geomatics Technologies and Applications
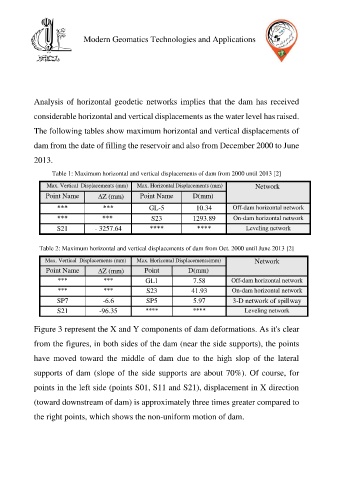
Analysis of horizontal geodetic networks implies that the dam has received
considerable horizontal and vertical displacements as the water level has raised.
The following tables show maximum horizontal and vertical displacements of
dam from the date of filling the reservoir and also from December 2000 to June
2013.
Table 1: Maximum horizontal and vertical displacements of dam from 2000 until 2013 [2]
Max. Vertical Displacements (mm) Max. Horizontal Displacements (mm) Network
Point Name Z (mm) Point Name D(mm)
*** *** GL-5 10.34 Off-dam horizontal network
*** *** S23 1293.89 On-dam horizontal network
S21 - 3257.64 **** **** Leveling network
Table 2: Maximum horizontal and vertical displacements of dam from Oct. 2000 until June 2013 [2]
Max. Vertical Displacements (mm) Max. Horizontal Displacements(mm) Network
Point Name Z (mm) Point D(mm)
*** *** Name 7.58 Off-dam horizontal network
GL1
*** *** S23 41.93 On-dam horizontal network
SP7 -6.6 SP5 5.97 3-D network of spillway
S21 -96.35 **** **** Leveling network
Figure 3 represent the X and Y components of dam deformations. As it's clear
from the figures, in both sides of the dam (near the side supports), the points
have moved toward the middle of dam due to the high slop of the lateral
supports of dam (slope of the side supports are about 70%). Of course, for
points in the left side (points S01, S11 and S21), displacement in X direction
(toward downstream of dam) is approximately three times greater compared to
the right points, which shows the non-uniform motion of dam.