Page 352 - Records of Bahrain (7) (ii)_Neat
P. 352

742                       Records of Bahrain

                                       14.


                     areas they accounted for 16°/>.   The reason for the
                     high figures for the urban areas is the exceptionally
                      largo number of baraotia in Manama Suburbs v/hich are

                      classed a3 ’Urban'.    The proportion of barustio in
                      each of the urban areas v/aa aa follows
                                                      *
                                 Manama              23.2
                                 Manama suburbs      51.2
                                  Moharraq           10.9
                                  Moharraq suburbs 23.3
                                  Hodd                7.3
                                  Rifaaa              5.1
                                  Sitra              15.7
                                  Jidhafs            22.2
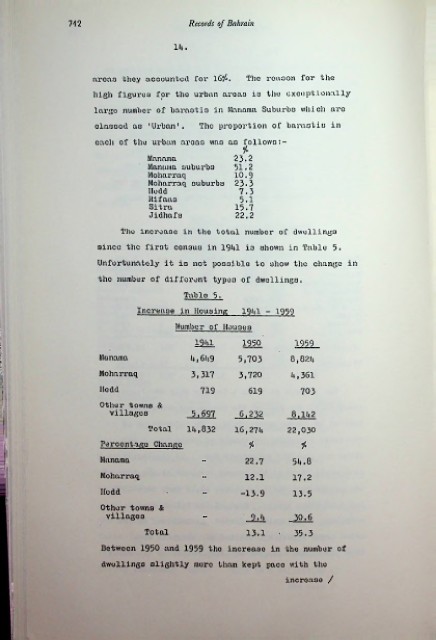
                            The increase in the total number of dwellings

                      since the fir3t census in 1941 ia shown in Table 5.
                      Unfortunately it ia not possible to show the change in
                       the number of different typos of dwellings.
                                         Table 5.
                               Increase in Housing 1941 - 1959
                                        Number of Houaea

                                            1941      1930        1959
 !
 :                     51anama             4,649     5,703       0,024
  ■
  .                    Moharraq            3,317      3,720      4,361
                       Hedd                  719        619        703
                       Other towns &
                         villages          5,697      6,232      0,142
                                  Total 14,032       16,274     22,030

                       Percentage Change
  ■
                       Manama                          22.7      54.0
                       Moharraq                        12.1      17.2
                       Ilodd                          -13.9      13.5
                       Other towns &
                        village3                                  30.6

                                 Total                 13.1       35.3
                       Between 1950 and 1959 the increase in the number of
                       dwellings slightly more than kept paco with the
                                                                increase /
   347   348   349   350   351   352   353   354   355   356   357