
Page 57 - نموذج
P. 57
16
454 Writing Proposals
well-known person in the field. Two other kinds of appendixes deserve spe-
cial mention: the task schedule and the description of evaluation techniques.
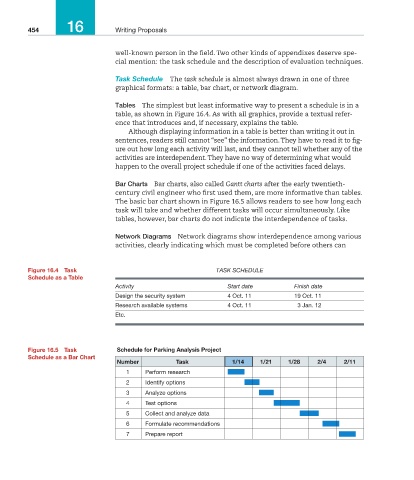
Task Schedule The task schedule is almost always drawn in one of three
graphical formats: a table, bar chart, or network diagram.
Tables The simplest but least informative way to present a schedule is in a
table, as shown in Figure 16.4. As with all graphics, provide a textual refer-
ence that introduces and, if necessary, explains the table.
Although displaying information in a table is better than writing it out in
sentences, readers still cannot “see” the information. They have to read it to fig-
ure out how long each activity will last, and they cannot tell whether any of the
activities are interdependent. They have no way of determining what would
happen to the overall project schedule if one of the activities faced delays.
Bar Charts Bar charts, also called Gantt charts after the early twentieth-
century civil engineer who first used them, are more informative than tables.
The basic bar chart shown in Figure 16.5 allows readers to see how long each
task will take and whether different tasks will occur simultaneously. Like
tables, however, bar charts do not indicate the interdependence of tasks.
network Diagrams Network diagrams show interdependence among various
activities, clearly indicating which must be completed before others can
figure 16.4 task Task sCHedule
schedule as a table
activity start date Finish date
Design the security system 4 Oct. 11 19 Oct. 11
Research available systems 4 Oct. 11 3 Jan. 12
Etc.
figure 16.5 task Schedule for Parking Analysis Project
schedule as a bar chart
Number Task 1/14 1/21 1/28 2/4 2/11
1 Perform research
2 Identify options
3 Analyze options
4 Test options
5 Collect and analyze data
6 Formulate recommendations
7 Prepare report
16_MAR_67948_Ch16_439-465.indd 454 11/29/11 3:35 PM