
Page 58 - نموذج
P. 58
The Structure of the Proposal 16 455
TECH TIP
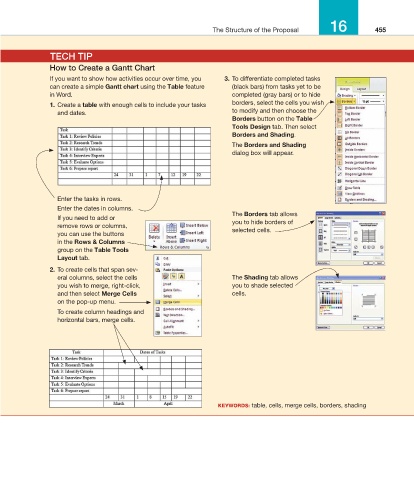
How to Create a Gantt Chart
If you want to show how activities occur over time, you 3. To differentiate completed tasks
can create a simple gantt chart using the table feature (black bars) from tasks yet to be
in Word. completed (gray bars) or to hide
1. Create a table with enough cells to include your tasks borders, select the cells you wish
and dates. to modify and then choose the
borders button on the table
tools design tab. Then select
borders and shading.
The borders and shading
dialog box will appear.
Enter the tasks in rows.
Enter the dates in columns.
If you need to add or The borders tab allows
remove rows or columns, you to hide borders of
you can use the buttons selected cells.
in the rows & columns
group on the table tools
layout tab.
2. To create cells that span sev-
eral columns, select the cells The shading tab allows
you wish to merge, right-click, you to shade selected
and then select Merge cells cells.
on the pop-up menu.
To create column headings and
horizontal bars, merge cells.
Keywords: table, cells, merge cells, borders, shading
16_MAR_67948_Ch16_439-465.indd 455 11/29/11 3:35 PM