
Page 125 - BBLP ejournal2018.docx
P. 125
Journal of Biotechnology in Livestock Production
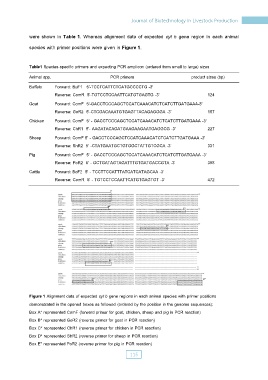
were shown in Table 1. Whereas alignment data of expected cyt b gene region in each animal
species with primer positions were given in Figure 1.
Table1 Species-specific primers and expecting PCR amplicon (ordered from small to large) sizes
Animal spp. PCR primers product sizes (bp)
Buffalo Forward: BuF1 5’-TCCTCATTCTCATGCCCCTG -3'
Reverse: ComR 5'-TGTCCTCCAATTCATGTGAGTG -3' 124
Goat Forward: ComF 5'-GACCTCCCAGCTCCATCAAACATCTCATCTTGATGAAA-3'
Reverse: GoR2 5'-CTCGACAAATGTGAGTTACAGAGGGA -3' 157
Chicken Forward: ComF 5' - GACCTCCCAGCTCCATCAAACATCTCATCTTGATGAAA -3'
Reverse: ChR1 5'- AAGATACAGATGAAGAAGAATGAGGCG -3' 227
Sheep Forward: ComF 5' - GACCTCCCAGCTCCATCAAACATCTCATCTTGATGAAA -3'
Reverse: ShR2 5’ -CTATGAATGCTGTGGCTATTGTCGCA -3’ 331
Pig Forward: ComF 5' - GACCTCCCAGCTCCATCAAACATCTCATCTTGATGAAA -3'
Reverse: PoR2 5' - GCTGATAGTAGATTTGTGATGACCGTA -3' 398
Cattle Forward: BoF2 5' - TCCTTCCATTTATCATCATAGCAA -3'
Reverse: ComR 5' - TGTCCTCCAATTCATGTGAGTGT -3' 472
Figure 1 Alignment data of expected cyt b gene regions in each animal species with primer positions
demonstrated in the opened boxes as followed (ordered by the position in the genome sequences):
Box A* represented ComF (forward primer for goat, chicken, sheep and pig in PCR reaction)
Box B* represented GoR2 (reverse primer for goat in PCR reaction)
Box C* represented ChR1 (reverse primer for chicken in PCR reaction)
Box D* represented ShR2 (reverse primer for sheep in PCR reaction)
Box E* represented PoR2 (reverse primer for pig in PCR reaction)
115