
Page 127 - BBLP ejournal2018.docx
P. 127
Journal of Biotechnology in Livestock Production
0.2 ng of pig DNA. Therefore, the least concentration of detectable pig DNA was 0.5ng (1:0.025 v/v
ratio).The test had been performed in 3 replications (data not shown).
473 cattle
331 pig
Figure 3 Agarose gel electrophoresis of Mixed DNA from cattle and pig in different dilutions
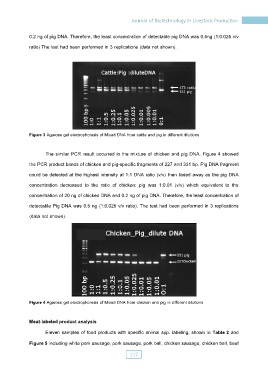
The similar PCR result occurred in the mixture of chicken and pig DNA. Figure 4 showed
the PCR product bands of chicken and pig-specific fragments of 227 and 331 bp. Pig DNA fragment
could be detected at the highest intensity at 1:1 DNA ratio (v/v) then faded away as the pig DNA
concentration decreased to the ratio of chicken: pig was 1:0.01 (v/v) which equivalent to the
concentration of 20 ng of chicken DNA and 0.2 ng of pig DNA. Therefore, the least concentration of
detectable Pig DNA was 0.5 ng (1:0.025 v/v ratio). The test had been performed in 3 replications
(data not shown).
Figure 4 Agarose gel electrophoresis of Mixed DNA from chicken and pig in different dilutions
Meat-labeled product analysis
Eleven samples of food products with specific animal spp. labeling, shown in Table 2 and
Figure 5 including white pork sausage, pork sausage, pork ball, chicken sausage, chicken ball, beef
117