
Page 126 - BBLP ejournal2018.docx
P. 126
วารสารเทคโนโลยีชีวภาพการผลิตปศุสัตว์
Box F* represented BoF2 (forward primer for cattle in PCR reaction)
Box G* represented BuF1 (forward primer for buffalo in PCR reaction)
Box H* represented ComR (reverse primer for goat in PCR reaction)
PCR amplification of cyt b fragments
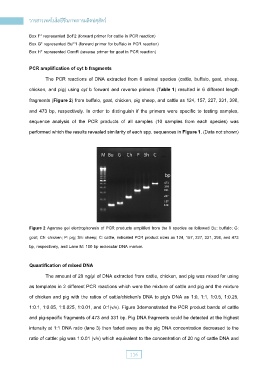
The PCR reactions of DNA extracted from 6 animal species (cattle, buffalo, goat, sheep,
chicken, and pig) using cyt b forward and reverse primers (Table 1) resulted in 6 different length
fragments (Figure 2) from buffalo, goat, chicken, pig sheep, and cattle as 124, 157, 227, 331, 398,
and 473 bp, respectively. In order to distinguish if the primers were specific to testing samples,
sequence analysis of the PCR products of all samples (10 samples from each species) was
performed which the results revealed similarity of each spp. sequences in Figure 1. (Data not shown)
Figure 2 Agarose gel electrophoresis of PCR products amplified from the 6 species as followed Bu: buffalo; G:
goat; Ch: chicken; P: pig; Sh: sheep; C: cattle, indicated PCR product sizes as 124, 157, 227, 331, 398, and 473
bp, respectively, and Lane M: 100 bp molecular DNA marker.
Quantification of mixed DNA
The amount of 20 ng/µl of DNA extracted from cattle, chicken, and pig was mixed for using
as templates in 2 different PCR reactions which were the mixture of cattle and pig and the mixture
of chicken and pig with the ratios of cattle/chicken’s DNA to pig’s DNA as 1:0, 1:1, 1:0.5, 1:0.25,
1:0.1, 1:0.05, 1:0.025, 1:0.01, and 0:1(v/v). Figure 3demonstrated the PCR product bands of cattle
and pig-specific fragments of 473 and 331 bp. Pig DNA fragments could be detected at the highest
intensity at 1:1 DNA ratio (lane 3) then faded away as the pig DNA concentration decreased to the
ratio of cattle: pig was 1:0.01 (v/v) which equivalent to the concentration of 20 ng of cattle DNA and
116