
Page 8 - Turkey Outlook 2022
P. 8
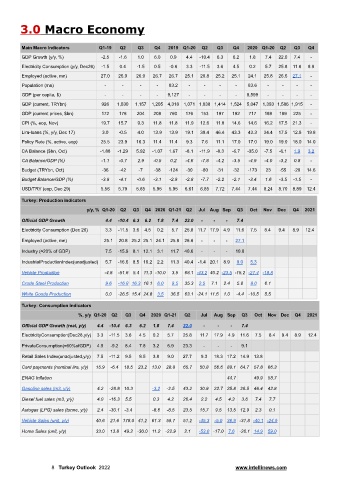
3.0 Macro Economy


         Main Macro Indicators      Q1-19  Q2    Q3    Q4   2019  Q1-20  Q2  Q3    Q4   2020 Q1-20  Q2  Q3   Q4
         GDP Growth (y/y, %)         -2.5  -1.6  1.0   6.0   0.9  4.4  -10.4  6.3  6.2   1.8  7.4  22.0  7.4  -
         Electricity Consumption (y/y, Dec26)  -1.5  0.4  -1.5  0.5  -0.6  3.3  -11.5  3.6  4.5  0.2  5.7  25.8  11.6  8.9
         Employed (active, mn)      27.0   26.9  26.9  26.7  26.7  25.1  20.8  25.2  25.1  24.1  25.8  26.6  27.1  -
         Population (mn)              -     -     -     -   83.2   -     -    -     -   83.6   -    -    -    -
         GDP (per capita, $)          -     -     -     -   9,127  -     -    -     -   8,599  -    -    -    -
         GDP (current, TRYbn)        926  1,030  1,157  1,205  4,318  1,071 1,038 1,414  1,524  5,047 1,393 1,586 1,915  -
         GDP (current prices, $bn)   172   176   204   208   760  176   153  197   192  717   189  189  225   -
         CPI (%, eop, Nov)          19.7   15.7  9.3   11.8  11.8  11.9  12.6  11.8  14.6  14.6  16.2  17.5  21.3  -
         Lira-loans (%, y/y, Dec 17)  3.0  -0.5  4.0   13.9  13.9  19.1  39.4  46.4  43.3  43.3  34.4  17.5  12.8  19.8
         Policy Rate (%, active, eop)  25.5  23.9  16.3  11.4  11.4  9.3  7.6  11.1  17.0  17.0  19.0  19.0  18.0  14.0

         CA Balance ($bn, Oct)      -1.88  -1.29  5.92  -1.07  1.67  -8.1  -11.9  -8.3  -6.7  -35.0  -7.5  -6.1  1.9  3.2
         CA Balance/GDP (%)          -1.1  -0.7  2.9   -0.5  0.2  -4.6  -7.8  -4.2  -3.5  -4.9  -4.0  -3.2  0.8  -
         Budget (TRYbn, Oct)         -36   -42    -7   -38  -124  -30   -80  -31   -32  -173  23   -55  -29  14.6
         Budget Balance/GDP (%)      -3.9  -4.1  -0.6  -3.1  -2.9  -2.8  -7.7  -2.2  -2.1  -3.4  1.6  -3.5  -1.5  -
         USD/TRY (eop, Dec 29)      5.56   5.79  5.65  5.95  5.95  6.61  6.85  7.72  7.44  7.44  8.24  8.70  8.89  12.4
         Turkey: Production indicators
                                y/y, % Q1-20  Q2  Q3  Q4 2020 Q1-21  Q2  Jul  Aug Sep  Q3  Oct  Nov  Dec  Q4  2021

         Official GDP Growth          4.4  -10.4 6.3  6.2  1.8  7.4  22.0  -  -  -  7.4
         Electricity Consumption (Dec 26)  3.3  -11.5  3.6  4.5  0.2  5.7  25.8 11.7 17.9  4.9  11.6  7.5  8.4  9.4  8.9  12.4
         Employed (active, mn)        25.1  20.8 25.2 25.1 24.1  25.8  26.6  -  -  -  27.1
         Industry (≈20% of GDP)       7.5  -15.9 8.1 12.1  3.1  11.7  40.6  -  -  -  10.0

         IndustrialProductionIndex(unadjusted)  5.7  -16.6 8.5 10.2  2.2  11.3  40.4  -1.4 20.1  8.9  9.0  5.3
         Vehicle Production           -4.8  -51.6 5.4 11.3 -10.0  3.5  68.1 -43.2 40.2 -23.5 -15.2 -27.4 -18.8

         Crude Steel Production       9.6  -16.8 16.3 16.1  6.0  9.5  35.3  2.5  7.1  2.4  5.8  8.0  6.1
         White Goods Production       0.0  -26.5 15.4 24.8  3.5  36.5  63.1 -24.1 11.6  1.0  -4.4  -10.5  5.5
         Turkey: Consumption indicators
                             %, y/y Q1-20  Q2  Q3  Q4  2020 Q1-21  Q2   Jul  Aug Sep  Q3  Oct  Nov Dec   Q4  2021

         Official GDP Growth (real, y/y)  4.4  -10.4  6.3  6.2  1.8  7.4  22.0  -  -  -  7.4
         ElectricityConsumption(Dec26,y/y)  3.3  -11.5  3.6  4.5  0.2  5.7  25.8  11.7  17.9  4.9  11.6  7.5  8.4  9.4  8.9  12.4
         PrivateConsumption(≈60%ofGDP)  4.9  -9.2  8.4  7.8  3.2  6.9  23.3  -  -  -  9.1

         Retail Sales Index(unadjusted,y/y)  7.5  -11.2  9.5  8.5  3.8  9.0  27.7  9.3  18.3 17.2 14.9  13.8
         Card payments (nominal lira, y/y)  15.9  -6.4  18.5  23.2  13.0  28.8  65.7  50.8  56.6 89.1 64.7  57.8  66.3
         ENAG Inflation                                                          44.7     49.9  58.7

         Gasoline sales (m3, y/y)  4.2  -28.8 10.3     -3.2  -2.5  43.2  30.9  22.7 25.8 26.5  46.4  42.8
         Diesel fuel sales (m3, y/y)  4.0  -16.3  5.5  0.3  4.2  26.4   2.2  4.5  4.3  3.6  7.4  7.7
         Autogas (LPG) sales (tonne, y/y)  2.4  -30.1  -3.4  -8.6  -8.5  23.5  15.7  9.5  13.5 12.9  2.3  0.1

         Vehicle Sales (unit, y/y)  40.6  21.6 178.0 41.2  61.3  59.7  51.2  -45.3  -5.0  36.9 -31.8 -40.1 -24.9
         Home Sales (unit, y/y)    33.0  13.8  49.2 -30.0 11.2  -22.9  2.1  -53.0 -17.0  7.6  -26.1 14.9  59.0


                   8 Turkey Outlook 2022                                            www.intellinews.com