
Page 88 - Power of Stem Cells- arthritis and regeneration
P. 88
48 B. Ye et al. / Materials Science and Engineering C 68 (2016) 43–51
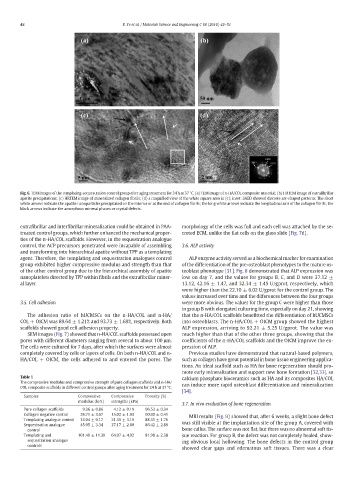
Fig. 6. TEM images of the templating-sequestration control group after aging treatment for 24 h at 37 °C. (a) TEM image of n-HA/COL composite material; (b) HRTEM image of extrafibrillar
apatite precipitations; (c) HRTEM image of mineralized collagen fibrils; (d) a magnified view of the white square area in (c); inset: SAED showed discrete arc-shaped patterns. The short
white arrows indicate the apatite nanoparticles precipitated on the interior or at the end of collagen fibrils; the long white arrows indicate the longitudinal axis of the collagen fibrils; the
black arrows indicate the amorphous mineral phases or crystal defects.
extrafibrillar and interfibrillar mineralization could be obtained in PAA- morphology of the cells was full and each cell was attached by the se-
treated control groups, which further enhanced the mechanical proper- creted ECM, unlike the flat cells on the glass slide (Fig. 7d).
ties of the n-HA/COL scaffolds. However, in the sequestration analogue
control, the ACP precursors penetrated were incapable of assembling 3.6. ALP activity
and transforming into hierarchical apatite without TPP as a templating
agent. Therefore, the templating and sequestration analogues control ALP enzyme activity served as a biochemical marker for examination
group exhibited higher compressive modulus and strength than that of the differentiation of the pre-osteoblast phenotypes to the mature os-
of the other control group due to the hierarchical assembly of apatite teoblast phenotype [31]. Fig. 8 demonstrated that ALP expression was
nanoplatelets directed by TPP within fibrils and the extrafibrillar miner- low on day 7, and the values for groups B, C, and D were 37.12 ±
al layer. 13.12, 42.16 ± 1.47, and 32.34 ± 1.45 U/gprot, respectively, which
were higher than the 22.10 ± 6.02 U/gprot for the control group. The
values increased over time and the differences between the four groups
3.5. Cell adhesion were more obvious. The values for the group C were higher than those
in group B with elongated culturing time, especially on day 21, showing
The adhesion ratio of hUCMSCs on the n-HA/COL and n-HA/ that the n-HA/COL scaffolds benefitted the differentiation of hUCMSCs
COL + OICM was 89.64 ± 1.21% and 93.73 ± 1.69%, respectively. Both into osteoblasts. The n-HA/COL + OICM group showed the highest
scaffolds showed good cell adhesion property. ALP expression, arriving to 92.21± 5.25 U/gprot. Thevalue was
SEM images (Fig. 7) showed that n-HA/COL scaffolds possessed open much higher than that of the other three groups, showing that the
pores with different diameters ranging from several to about 100 μm. coefficients of the n-HA/COL scaffolds and the OICM improve the ex-
The cells were cultured for 7 days, after which the surfaces were almost pression of ALP.
completely covered by cells or layers of cells. On both n-HA/COL and n- Previous studies have demonstrated that natural-based polymers,
HA/COL + OICM, the cells adhered to and entered the pores. The such as collagen have great potential in bone tissue engineering applica-
tions. An ideal scaffold such as HA for bone regeneration should pro-
mote early mineralization and support new bone formation [32,33],so
Table 1 calcium phosphate bioceramics such as HA and its composites HA/COL
The compressive modulus and compressive strength of pure collagen scaffolds and n-HA/
COL composite scaffolds in different control groups after aging treatment for 24 h at 37 °C. can induce more rapid osteoblast differentiation and mineralization
[34].
Samples Compressive Compressive Porosity (%)
modulus (kPa) strengths (kPa)
3.7. In vivo evaluation of bone regeneration
Pure collagen scaffolds 9.36 ± 0.86 4.12 ± 0.19 96.53 ± 0.34
Collagen negative control 26.71 ± 3.67 15.02 ± 1.93 90.90 ± 0.41 MRI results (Fig. 9) showed that, after 6 weeks, a slight bone defect
Templating analogue control 33.04 ± 0.17 21.35 ± 3.19 88.31 ± 1.76
Sequestration analogue 45.05 ± 3.34 37.17 ± 2.60 86.42 ± 2.89 was still visible at the implantation site of the group A, covered with
control bone callus. The surface was not flat, but there was no abnormal soft tis-
Templating and 101.49 ± 11.39 64.07 ± 4.02 81.98 ± 2.38 sue reaction. For group B, the defect was not completely healed, show-
sequestration analogue ing obvious local hollowing. The bone defects in the control group
controls
showed clear gaps and edematous soft tissues. There was a clear