
Page 15 - Basic Statistics
P. 15
10
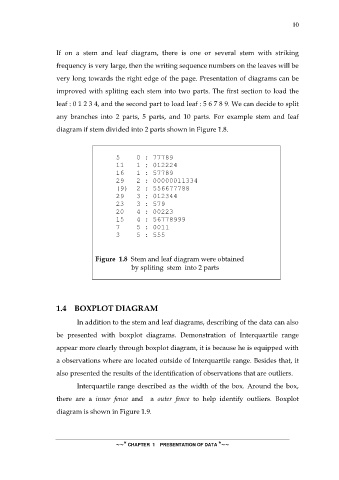
If on a stem and leaf diagram, there is one or several stem with striking
frequency is very large, then the writing sequence numbers on the leaves will be
very long towards the right edge of the page. Presentation of diagrams can be
improved with spliting each stem into two parts. The first section to load the
leaf : 0 1 2 3 4, and the second part to load leaf : 5 6 7 8 9. We can decide to split
any branches into 2 parts, 5 parts, and 10 parts. For example stem and leaf
diagram if stem divided into 2 parts shown in Figure 1.8.
5 0 : 77789
11 1 : 012224
16 1 : 57789
29 2 : 00000011334
(9) 2 : 556677788
29 3 : 012344
23 3 : 579
20 4 : 00223
15 4 : 56778999
7 5 : 0011
3 5 : 555
Figure 1.8 Stem and leaf diagram were obtained
by spliting stem into 2 parts
1.4 BOXPLOT DIAGRAM
In addition to the stem and leaf diagrams, describing of the data can also
be presented with boxplot diagrams. Demonstration of Interquartile range
appear more clearly through boxplot diagram, it is because he is equipped with
a observations where are located outside of Interquartile range. Besides that, it
also presented the results of the identification of observations that are outliers.
Interquartile range described as the width of the box. Around the box,
there are a inner fence and a outer fence to help identify outliers. Boxplot
diagram is shown in Figure 1.9.
~~* CHAPTER 1 PRESENTATION OF DATA *~~