
Page 10 - Basic Statistics
P. 10
5
1.2 HISTOGRAM AND FREQUENCY POLYGON
The actual limits of the class and the middle class becomes an important
point when we want to demonstrate the distribution of the data with
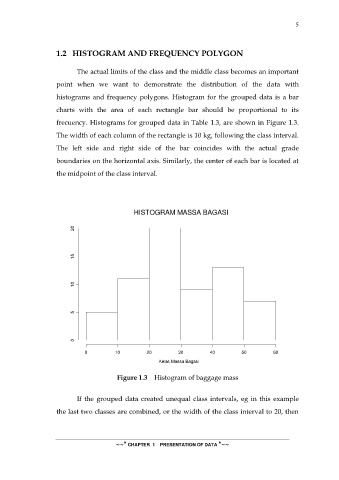
histograms and frequency polygons. Histogram for the grouped data is a bar
charts with the area of each rectangle bar should be proportional to its
frecuency. Histograms for grouped data in Table 1.3, are shown in Figure 1.3.
The width of each column of the rectangle is 10 kg, following the class interval.
The left side and right side of the bar coincides with the actual grade
boundaries on the horizontal axis. Similarly, the center of each bar is located at
the midpoint of the class interval.
HISTOGRAM MASSA BAGASI
20
15
10
5
0
0 10 20 30 40 50 60
Kelas Massa Bagasi
Figure 1.3 Histogram of baggage mass
If the grouped data created unequal class intervals, eg in this example
the last two classes are combined, or the width of the class interval to 20, then
~~* CHAPTER 1 PRESENTATION OF DATA *~~