
Page 8 - Basic Statistics
P. 8
3
Determination of the class interval and the number of classes for a set of
data is done by first reviewing range of the data, the smallest observed values
(minimum score) and the largest observed values (maximum score). The range
of the data is the difference between the minimum score with a maximum score.
The more class then the description of the data will be more looks simple, but
the missing information is also growing.
After the determination of the class and the class intervals, do taurus /
Tolly to each observation from the data. The number of observations in a class is
the frequency of the class. For certain purposes, in the frequency table are often
added cumulative frequency column, relative frequency, and the midpoint of
each class interval.
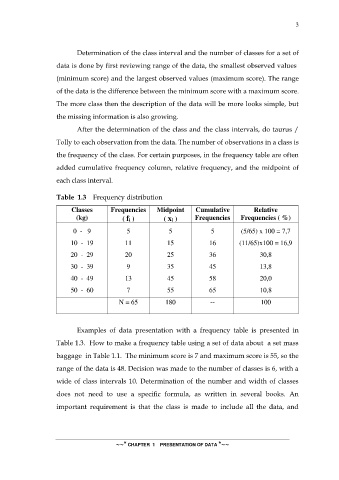
Table 1.3 Frequency distribution
Classes Frequencies Midpoint Cumulative Relative
(kg) ( fi ) ( xi ) Frequencies Frequencies ( %)
0 - 9 5 5 5 (5/65) x 100 = 7,7
10 - 19 11 15 16 (11/65)x100 = 16,9
20 - 29 20 25 36 30,8
30 - 39 9 35 45 13,8
40 - 49 13 45 58 20,0
50 - 60 7 55 65 10,8
N = 65 180 -- 100
Examples of data presentation with a frequency table is presented in
Table 1.3. How to make a frequency table using a set of data about a set mass
baggage in Table 1.1. The minimum score is 7 and maximum score is 55, so the
range of the data is 48. Decision was made to the number of classes is 6, with a
wide of class intervals 10. Determination of the number and width of classes
does not need to use a specific formula, as written in several books. An
important requirement is that the class is made to include all the data, and
~~* CHAPTER 1 PRESENTATION OF DATA *~~