
Page 9 - Basic Statistics
P. 9
4
considering how simple the desired presentation. The main thing that also
needs is how to define a class interval, which determines the lower limit and
upper limit of the class interval.
There are two ways that are often used to define the class interval. The
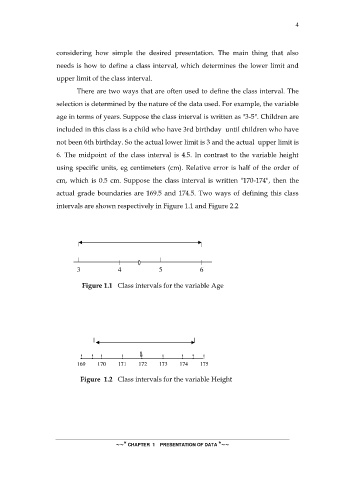
selection is determined by the nature of the data used. For example, the variable
age in terms of years. Suppose the class interval is written as "3-5". Children are
included in this class is a child who have 3rd birthday until children who have
not been 6th birthday. So the actual lower limit is 3 and the actual upper limit is
6. The midpoint of the class interval is 4.5. In contrast to the variable height
using specific units, eg centimeters (cm). Relative error is half of the order of
cm, which is 0.5 cm. Suppose the class interval is written "170-174", then the
actual grade boundaries are 169.5 and 174.5. Two ways of defining this class
intervals are shown respectively in Figure 1.1 and Figure 2.2
3 4 5 6
Figure 1.1 Class intervals for the variable Age
! ! ! ! ! ! ! ! !
169 170 171 172 173 174 175
Figure 1.2 Class intervals for the variable Height
~~* CHAPTER 1 PRESENTATION OF DATA *~~