
Page 13 - Basic Statistics
P. 13
8
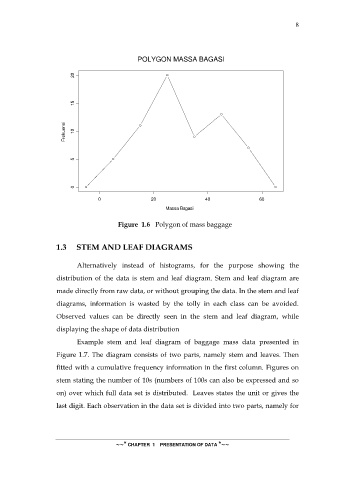
POLYGON MASSA BAGASI
20
15
Frekuensi 10
5
0
0 20 40 60
Massa Bagasi
Figure 1.6 Polygon of mass baggage
1.3 STEM AND LEAF DIAGRAMS
Alternatively instead of histograms, for the purpose showing the
distribution of the data is stem and leaf diagram. Stem and leaf diagram are
made directly from raw data, or without grouping the data. In the stem and leaf
diagrams, information is wasted by the tolly in each class can be avoided.
Observed values can be directly seen in the stem and leaf diagram, while
displaying the shape of data distribution
Example stem and leaf diagram of baggage mass data presented in
Figure 1.7. The diagram consists of two parts, namely stem and leaves. Then
fitted with a cumulative frequency information in the first column. Figures on
stem stating the number of 10s (numbers of 100s can also be expressed and so
on) over which full data set is distributed. Leaves states the unit or gives the
last digit. Each observation in the data set is divided into two parts, namely for
~~* CHAPTER 1 PRESENTATION OF DATA *~~