
Page 12 - Basic Statistics
P. 12
7
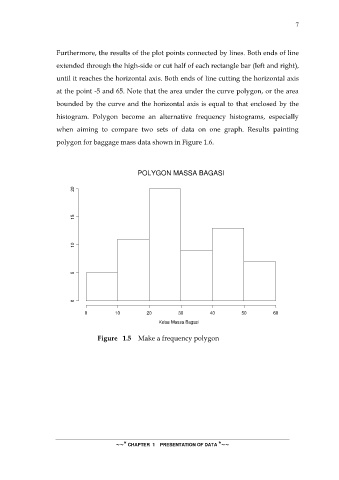
Furthermore, the results of the plot points connected by lines. Both ends of line
extended through the high-side or cut half of each rectangle bar (left and right),
until it reaches the horizontal axis. Both ends of line cutting the horizontal axis
at the point -5 and 65. Note that the area under the curve polygon, or the area
bounded by the curve and the horizontal axis is equal to that enclosed by the
histogram. Polygon become an alternative frequency histograms, especially
when aiming to compare two sets of data on one graph. Results painting
polygon for baggage mass data shown in Figure 1.6.
POLYGON MASSA BAGASI
20
15
10
5
0
0 10 20 30 40 50 60
Kelas Massa Bagasi
Figure 1.5 Make a frequency polygon
~~* CHAPTER 1 PRESENTATION OF DATA *~~