
Page 7 - Basic Statistics
P. 7
2
1. PRESENTATION OF DATA WITH TABLE AND CHART
1.1 DESCRIBING DATA WITH FREQUENCY TABLE
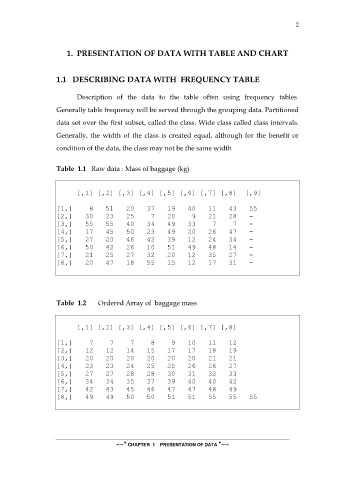
Description of the data to the table often using frequency tables.
Generally table frequency will be served through the grouping data. Partitioned
data set over the first subset, called the class. Wide class called class intervals.
Generally, the width of the class is created equal, although for the benefit or
condition of the data, the class may not be the same width
Table 1.1 Raw data : Mass of baggage (kg)
[,1] [,2] [,3] [,4] [,5] [,6] [,7] [,8] [,9]
[1,] 8 51 20 37 19 40 11 43 55
[2,] 30 23 25 7 20 9 21 28 -
[3,] 55 55 40 34 49 33 7 7 -
[4,] 17 45 50 23 49 20 26 47 -
[5,] 27 20 46 42 39 12 24 34 -
[6,] 50 42 26 10 51 49 48 14 -
[7,] 21 25 27 32 20 12 35 27 -
[8,] 20 47 18 55 15 12 17 31 -
Table 1.2 Ordered Array of baggage mass
[,1] [,2] [,3] [,4] [,5] [,6] [,7] [,8]
[1,] 7 7 7 8 9 10 11 12
[2,] 12 12 14 15 17 17 18 19
[3,] 20 20 20 20 20 20 21 21
[4,] 23 23 24 25 25 26 26 27
[5,] 27 27 28 28 30 31 32 33
[6,] 34 34 35 37 39 40 40 42
[7,] 42 43 45 46 47 47 48 49
[8,] 49 49 50 50 51 51 55 55 55
~~* CHAPTER 1 PRESENTATION OF DATA *~~