
Page 191 - draft
P. 191
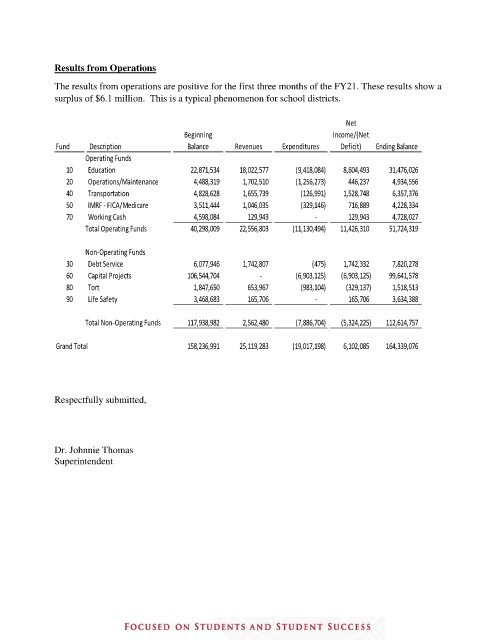
Results from Operations
               The results from operations are positive for the first three months of the FY21. These results show a
               surplus of $6.1 million.  This is a typical phenomenon for school districts.


                                                                                       Net
                                               Beginning                            Income/(Net
               Fund     Description            Balance     Revenues    Expenditures  Deficit)  Ending Balance
                      Operating Funds
                 10    Education                         22,871,534           18,022,577                 (9,418,084)          8,604,493            31,476,026
                 20    Operations/Maintenance                4,488,319              1,702,510                 (1,256,273)              446,237               4,934,556
                 40    Transportation                      4,828,628              1,655,739                    (126,991)          1,528,748               6,357,376
                 50    IMRF - FICA/Medicare                3,511,444              1,046,035                    (329,146)              716,889               4,228,334
                 70    Working Cash                        4,598,084                 129,943                               -               129,943               4,728,027
                      Total Operating Funds              40,298,009           22,556,803              (11,130,494)  -    11,426,310            51,724,319


                      Non-Operating Funds
                 30    Debt Service                        6,077,946              1,742,807                             (475)          1,742,332               7,820,278
                 60    Capital Projects               106,544,704                          -                 (6,903,125)        (6,903,125)            99,641,578
                 80    Tort                                1,847,650                 653,967                    (983,104)            (329,137)               1,518,513
                 90    Life Safety                         3,468,683                 165,706                               -               165,706               3,634,388


                      Total Non-Operating Funds           117,938,982              2,562,480                 (7,886,704)  -    (5,324,225)          112,614,757

               Grand Total                            158,236,991           25,119,283              (19,017,198)  -    6,102,085          164,339,076


               Respectfully submitted,


               Dr. Johnnie Thomas
               Superintendent