
Page 76 - Shaping A Sustainable Future
P. 76
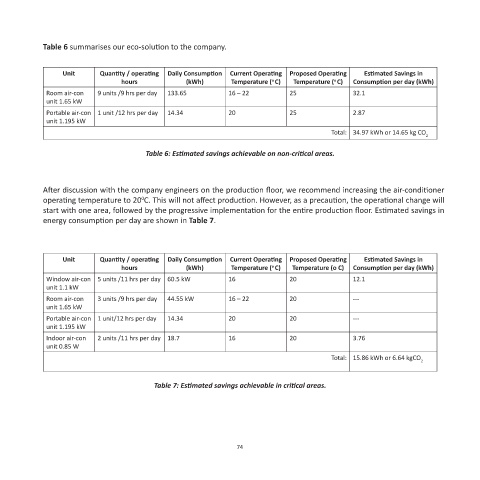
Table 6 summarises our eco-solution to the company.


                 Unit      Quantity / operating   Daily Consumption  Current Operating  Proposed Operating   Estimated Savings in
                                 hours           (kWh)       Temperature ( C)  Temperature ( C)  Consumption per day (kWh)
                                                                                        o
                                                                        o
             Room air-con   9 units /9 hrs per day  133.65  16 – 22         25               32.1
             unit 1.65 kW
             Portable air-con  1 unit /12 hrs per day  14.34  20            25               2.87
             unit 1.195 kW
                                                                                       Total: 34.97 kWh or 14.65 kg CO 2

                                       Table 6: Estimated savings achievable on non-critical areas.


            After discussion with the company engineers on the production floor, we recommend increasing the air-conditioner
            operating temperature to 20 C. This will not affect production. However, as a precaution, the operational change will
                                      0
            start with one area, followed by the progressive implementation for the entire production floor. Estimated savings in
            energy consumption per day are shown in Table 7.


                 Unit      Quantity / operating   Daily Consumption  Current Operating  Proposed Operating   Estimated Savings in
                                 hours           (kWh)       Temperature ( C)  Temperature (o C)  Consumption per day (kWh)
                                                                        o
             Window air-con  5 units /11 hrs per day 60.5 kW  16            20               12.1
             unit 1.1 kW
             Room air-con   3 units /9 hrs per day  44.55 kW  16 – 22       20               ---
             unit 1.65 kW
             Portable air-con  1 unit/12 hrs per day  14.34  20             20               ---
             unit 1.195 kW
             Indoor air-con   2 units /11 hrs per day 18.7  16              20               3.76
             unit 0.85 W
                                                                                       Total: 15.86 kWh or 6.64 kgCO 2


                                         Table 7: Estimated savings achievable in critical areas.


                                                               74