
Page 262 - Atlas of Small Animal CT and MRI
P. 262
252 Atlas of Small Animal CT and MRI
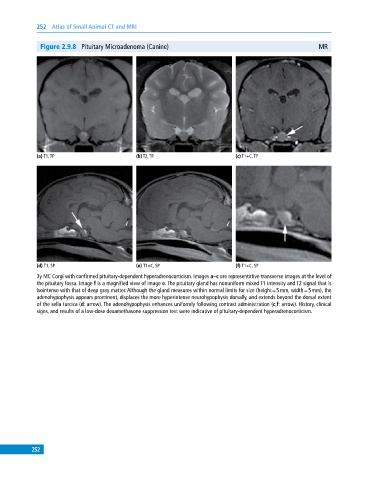
Figure 2.9.8 Pituitary Microadenoma (Canine) MR
(a) T1, TP (b) T2, TP (c) T1+C, TP
(d) T1, SP (e) T1+C, SP (f) T1+C, SP
3y MC Corgi with confirmed pituitary‐dependent hyperadrenocorticism. Images a–c are representative transverse images at the level of
the pituitary fossa. Image f is a magnified view of image e. The pituitary gland has nonuniform mixed T1 intensity and T2 signal that is
isointense with that of deep gray matter. Although the gland measures within normal limits for size (height = 5 mm, width = 5 mm), the
adenohypophysis appears prominent, displaces the more hyperintense neurohypophysis dorsally, and extends beyond the dorsal extent
of the sella turcica (d: arrow). The adenohypophysis enhances uniformly following contrast administration (c,f: arrow). History, clinical
signs, and results of a low‐dose dexamethasone suppression test were indicative of pituitary‐dependent hyperadrenocorticism.
252