
Page 263 - Atlas of Small Animal CT and MRI
P. 263
Sella and Parasellar Region 253
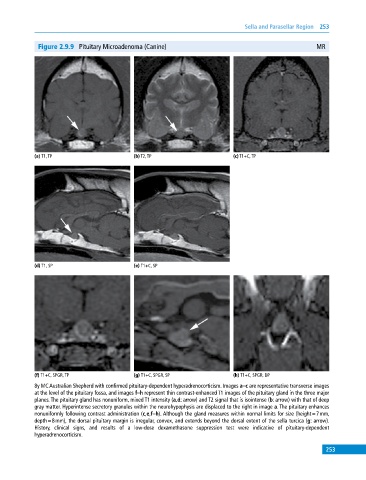
Figure 2.9.9 Pituitary Microadenoma (Canine) MR
(a) T1, TP (b) T2, TP (c) T1+C, TP
(d) T1, SP (e) T1+C, SP
(f) T1+C, SPGR, TP (g) T1+C, SPGR, SP (h) T1+C, SPGR, DP
8y MC Australian Shepherd with confirmed pituitary‐dependent hyperadrenocorticism. Images a–c are representative transverse images
at the level of the pituitary fossa, and images f–h represent thin contrast‐enhanced T1 images of the pituitary gland in the three major
planes. The pituitary gland has nonuniform, mixed T1 intensity (a,d: arrow) and T2 signal that is isointense (b: arrow) with that of deep
gray matter. Hyperintense secretory granules within the neurohypophysis are displaced to the right in image a. The pituitary enhances
nonuniformly following contrast administration (c,e,f–h). Although the gland measures within normal limits for size (height = 7 mm,
depth = 8 mm), the dorsal pituitary margin is irregular, convex, and extends beyond the dorsal extent of the sella turcica (g: arrow).
History, clinical signs, and results of a low‐dose dexamethasone suppression test were indicative of pituitary‐dependent
hyperadrenocorticism.
253