
Page 264 - Atlas of Small Animal CT and MRI
P. 264
254 Atlas of Small Animal CT and MRI
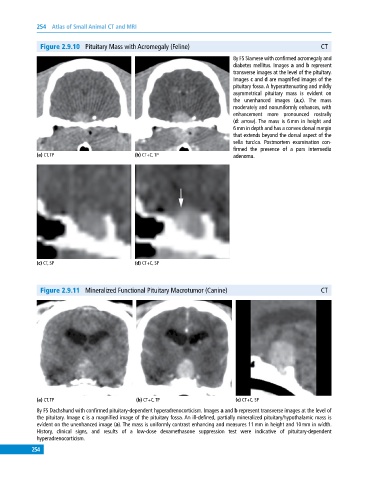
Figure 2.9.10 Pituitary Mass with Acromegaly (Feline) CT
8y FS Siamese with confirmed acromegaly and
diabetes mellitus. Images a and b represent
transverse images at the level of the pituitary.
Images c and d are magnified images of the
pituitary fossa. A hyperattenuating and mildly
asymmetrical pituitary mass is evident on
the unenhanced images (a,c). The mass
moderately and nonuniformly enhances, with
enhancement more pronounced rostrally
(d: arrow). The mass is 6 mm in height and
6 mm in depth and has a convex dorsal margin
that extends beyond the dorsal aspect of the
sella turcica. Postmortem examination con-
firmed the presence of a pars intermedia
(a) CT, TP (b) CT+C, TP adenoma.
(c) CT, SP (d) CT+C, SP
Figure 2.9.11 Mineralized Functional Pituitary Macrotumor (Canine) CT
(a) CT, TP (b) CT+C, TP (c) CT+C, SP
8y FS Dachshund with confirmed pituitary‐dependent hyperadrenocorticism. Images a and b represent transverse images at the level of
the pituitary. Image c is a magnified image of the pituitary fossa. An ill‐defined, partially mineralized pituitary/hypothalamic mass is
evident on the unenhanced image (a). The mass is uniformly contrast enhancing and measures 11 mm in height and 10 mm in width.
History, clinical signs, and results of a low‐dose dexamethasone suppression test were indicative of pituitary‐dependent
hyperadrenocorticism.
254