
Page 180 - BUKU SYNOPSIS
P. 180
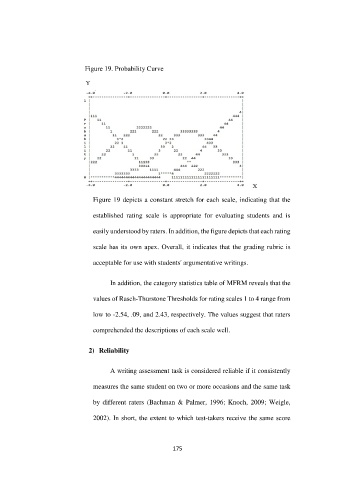
Figure 19. Probability Curve


                                  Figure 19 depicts a constant stretch for each scale, indicating that the

                                  established  rating  scale  is  appropriate  for  evaluating  students  and  is


                                  easily understood by raters. In addition, the figure depicts that each rating

                                  scale has its own apex. Overall, it indicates that the grading rubric is


                                  acceptable for use with students' argumentative writings.


                                            In addition, the category statistics table of MFRM reveals that the


                                  values of Rasch-Thurstone Thresholds for rating scales 1 to 4 range from

                                  low to -2.54, .09, and 2.43, respectively. The values suggest that raters


                                  comprehended the descriptions of each scale well.


                                2)  Reliability


                                            A writing assessment task is considered reliable if it consistently


                                  measures the same student on two or more occasions and the same task

                                  by  different  raters  (Bachman  &  Palmer,  1996;  Knoch,  2009;  Weigle,


                                  2002). In short, the extent to which test-takers receive the same score


                                                              175