
Page 15 - Swale AQMA Feasibility Study April 2020_
P. 15
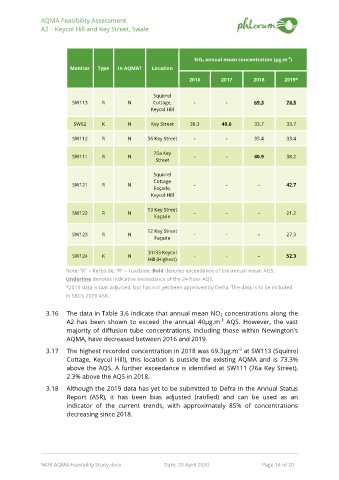
AQMA Feasibility Assessment
               A2 – Keycol Hill and Key Street, Swale


                                                                     NO 2  annual mean concentration (μg.m )
                                                                                                      -3
                          Monitor   Type   In AQMA?   Location

                                                                   2016        2017       2018       2019*

                                                       Squirrel
                          SW113      R        N        Cottage,      -          -         69.3        74.5
                                                      Keycol Hill

                           SW62      K        N       Key Street    38.3       40.6       33.7        33.7


                          SW112      R        N      56 Key Street   -          -         35.4        33.4

                                                       76a Key
                          SW111      R        N                      -          -         40.9        38.2
                                                        Street

                                                       Squirrel
                                                       Cottage
                          SW121      R        N                      -          -           -         42.7
                                                       Façade,
                                                      Keycol Hill

                                                     13 Key Street
                          SW122      R        N                      -          -           -         21.2
                                                       Façade

                                                     12 Key Street
                          SW123      R        N                      -          -           -         27.3
                                                       Façade

                                                     31/33 Keycol
                          SW124      K        N                      -          -           -         52.3
                                                     Hill (Highest)
                        Note: “K” = Kerbside; “R” = roadside. Bold denotes exceedance of the annual mean AQS.
                        Underline denotes indicative exceedance of the 24 hour AQS.
                        *2019 data is bias adjusted, but has not yet been approved by Defra. The data is to be included
                        in SBC’s 2020 ASR.

                 3.16   The data in Table 3.6 indicate that annual mean NO2 concentrations along the
                                                                              -3
                        A2  has  been  shown  to  exceed  the  annual  40μg.m   AQS.  However,  the  vast
                        majority of diffusion tube concentrations, including  those within Newington’s
                        AQMA, have decreased between 2016 and 2019.

                                                                                     -3
                 3.17   The highest recorded concentration in 2018 was 69.3μg.m  at SW113 (Squirrel
                        Cottage,  Keycol  Hill),  this  location  is  outside  the  existing  AQMA  and  is  73.3%
                        above the AQS. A further exceedance is identified at  SW111 (76a Key Street),
                        2.3% above the AQS in 2018.
                 3.18   Although the 2019 data has yet to be submitted to Defra in the Annual Status
                        Report  (ASR),  it  has  been  bias  adjusted  (ratified)  and  can  be  used  as  an
                        indicator  of  the  current  trends,  with  approximately  85%  of  concentrations
                        decreasing since 2018.


               9438 AQMA Feasibility Study.docx            Date: 20 April 2020                     Page 14 of 20