
Page 11 - Swale AQMA Feasibility Study April 2020_
P. 11
AQMA Feasibility Assessment
A2 – Keycol Hill and Key Street, Swale
Local Air Quality
3.1 This chapter is intended to establish prevailing air quality conditions
surrounding Key Street and Keycol Hill.
Background Air Quality
3.2 Background air quality concentrations identify what the general background air
quality is within an area and is presented as background maps by Defra. The
main purpose of the background maps is to provide estimates of background
concentrations for specific pollutants. These can then be used in air quality
assessments to better understand the contribution of local sources to total
pollutant concentrations. They provide information on how pollutant
concentrations change over time and across a wide area; they also provide an
estimated breakdown of the relative sources of pollution.
5
3.3 The Defra UK-AIR maps provide predicted background pollution
concentrations for NO2, PM10 and PM2.5 for 2018 to 2023 are presented in
Tables 3.1, 3.2 and 3.3, respectively. These data were taken from the three
2
1km central grid squares encompassing the relevant area.
NO2
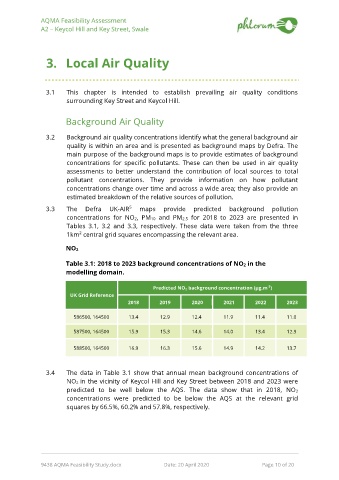
Table 3.1: 2018 to 2023 background concentrations of NO2 in the
modelling domain.
-3
Predicted NO 2 background concentration (μg.m )
UK Grid Reference
2018 2019 2020 2021 2022 2023
586500, 164500 13.4 12.9 12.4 11.9 11.4 11.0
587500, 164500 15.9 15.3 14.6 14.0 13.4 12.9
588500, 164500 16.9 16.3 15.6 14.9 14.2 13.7
3.4 The data in Table 3.1 show that annual mean background concentrations of
NO2 in the vicinity of Keycol Hill and Key Street between 2018 and 2023 were
predicted to be well below the AQS. The data show that in 2018, NO2
concentrations were predicted to be below the AQS at the relevant grid
squares by 66.5%, 60.2% and 57.8%, respectively.
9438 AQMA Feasibility Study.docx Date: 20 April 2020 Page 10 of 20