
Page 12 - Swale AQMA Feasibility Study April 2020_
P. 12
AQMA Feasibility Assessment
A2 – Keycol Hill and Key Street, Swale
PM10
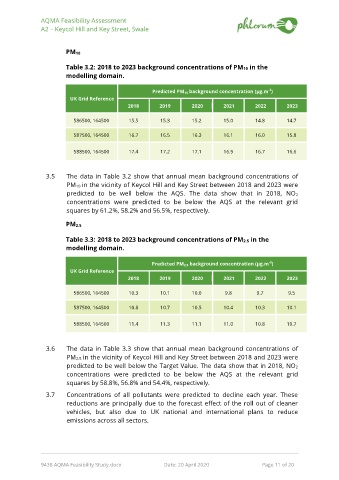
Table 3.2: 2018 to 2023 background concentrations of PM10 in the
modelling domain.
-3
Predicted PM 10 background concentration (μg.m )
UK Grid Reference
2018 2019 2020 2021 2022 2023
586500, 164500 15.5 15.3 15.2 15.0 14.8 14.7
587500, 164500 16.7 16.5 16.3 16.1 16.0 15.8
588500, 164500 17.4 17.2 17.1 16.9 16.7 16.6
3.5 The data in Table 3.2 show that annual mean background concentrations of
PM10 in the vicinity of Keycol Hill and Key Street between 2018 and 2023 were
predicted to be well below the AQS. The data show that in 2018, NO2
concentrations were predicted to be below the AQS at the relevant grid
squares by 61.2%, 58.2% and 56.5%, respectively.
PM2.5
Table 3.3: 2018 to 2023 background concentrations of PM2.5 in the
modelling domain.
-3
Predicted PM 2.5 background concentration (μg.m )
UK Grid Reference
2018 2019 2020 2021 2022 2023
586500, 164500 10.3 10.1 10.0 9.8 9.7 9.5
587500, 164500 10.8 10.7 10.5 10.4 10.3 10.1
588500, 164500 11.4 11.3 11.1 11.0 10.8 10.7
3.6 The data in Table 3.3 show that annual mean background concentrations of
PM2.5 in the vicinity of Keycol Hill and Key Street between 2018 and 2023 were
predicted to be well below the Target Value. The data show that in 2018, NO2
concentrations were predicted to be below the AQS at the relevant grid
squares by 58.8%, 56.8% and 54.4%, respectively.
3.7 Concentrations of all pollutants were predicted to decline each year. These
reductions are principally due to the forecast effect of the roll out of cleaner
vehicles, but also due to UK national and international plans to reduce
emissions across all sectors.
9438 AQMA Feasibility Study.docx Date: 20 April 2020 Page 11 of 20