Page 14 - Swale AQMA Feasibility Study April 2020_
P. 14

AQMA Feasibility Assessment
               A2 – Keycol Hill and Key Street, Swale


                        Note: “R” = roadside. Bold denotes exceedance of the AQS.

                 3.14   The data in Table 3.5 show that annual mean PM10 in other SBC AQMAs are
                        consistently below the AQS. The highest concentrations was on St Paul’s Street
                        in 2018, 29.7% below the AQS. These monitors are a significant distance from
                        Key Street and Keycol Hill and are therefore not considered representative of
                        local conditions.
                        Non-Automatic Monitoring


                        NO2

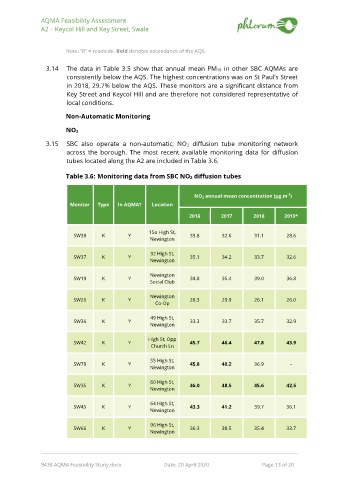
                 3.15   SBC  also  operate  a  non-automatic,  NO2  diffusion  tube  monitoring  network
                        across  the  borough.  The  most  recent  available  monitoring  data  for  diffusion
                        tubes located along the A2 are included in Table 3.6.


                        Table 3.6: Monitoring data from SBC NO2 diffusion tubes


                                                                                                      -3
                                                                     NO 2  annual mean concentration (μg.m )
                          Monitor   Type   In AQMA?   Location

                                                                   2016        2017       2018       2019*

                                                     15a High St,
                           SW38      K        Y                     33.8       32.6       31.1        28.6
                                                      Newington

                                                      32 High St,
                           SW37      K        Y                     35.1       34.2       33.7        32.6
                                                      Newington

                                                      Newington
                           SW19      K        Y                     34.8       35.4       39.0        36.8
                                                      Social Club
                                                      Newington
                           SW20      K        Y                     28.3       29.9       26.1        26.0
                                                        Co-Op

                                                      49 High St,
                           SW36      K        Y                     33.3       33.7       35.7        32.9
                                                      Newington

                                                     High St, Opp
                           SW42      K        Y                     45.7       46.4       47.8        43.9
                                                      Church Ln
                                                      55 High St,
                           SW78      K        Y                     45.8       40.2       36.9         -
                                                      Newington

                                                      60 High St,
                           SW35      K        Y                     46.0       48.5       45.6        42.5
                                                      Newington

                                                      64 High St,
                           SW45      K        Y                     43.3       41.2       39.7        36.1
                                                      Newington
                                                      96 High St,
                           SW66      K        Y                     36.3       38.5       35.4        33.7
                                                      Newington


               9438 AQMA Feasibility Study.docx            Date: 20 April 2020                     Page 13 of 20
   9   10   11   12   13   14   15   16   17   18   19