
Page 8 - Swale AQMA Feasibility Study April 2020_
P. 8
AQMA Feasibility Assessment
A2 – Keycol Hill and Key Street, Swale
2.6 Being background concentrations, the UK-AIR data are intended to represent a
homogenous mixture of all emissions sources within the general area of a
particular grid square location. Concentrations of pollutants at various
sensitive receptor locations can, therefore, be calculated by modelling the
emissions from a nearby pollution source, such as a busy road, and then
adding this to the appropriate UK-AIR background datum.
2.7 In order to determine the baseline air quality conditions for 2018, emissions
from local roads have been assessed using a detailed air dispersion model. The
model used was ADMS-Roads (version 4.1), which is produced by CERC and has
been validated and approved by Defra for use as an assessment tool for
calculating the dispersion of pollutants from traffic on UK roads. The latest
6
Defra Emissions Factor Toolkit (EFT) was used within the model to estimate
vehicle emissions.
2.8 Detailed, hourly sequential, meteorological data are used by the model to
determine pollutant transportation and levels of dilution by the wind and
vertical air movements. Meteorological data used in the model were obtained
from Gravesend as it was considered to provide the most representative data
of similar conditions to the site. The meteorological data used for this
assessment were from 2018, for which air quality monitoring and traffic data
were also available. The surface roughness applied to the model for the site
was 0.75m. A factor of 0.1m was applied to the meteorological site.
2.9 Receptor locations are indicated in Figure 1. Discrete model receptors were
positioned at the façades of buildings closest to the source of pollution (i.e.
roads). Receptors were modelled at “breathing height”, which was 1.5m for
most locations. Receptors are, therefore, positioned in worst-case locations, for
a conservative approach. The locations were agreed with SBC’s Environmental
Health Department.
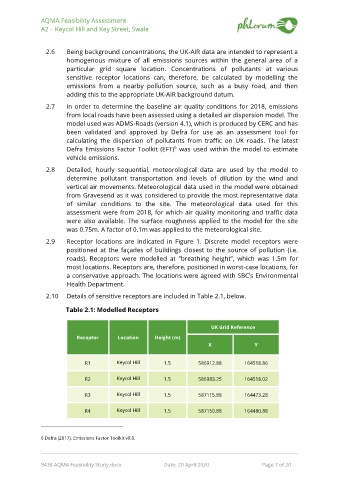
2.10 Details of sensitive receptors are included in Table 2.1, below.
Table 2.1: Modelled Receptors
UK Grid Reference
Receptor Location Height (m)
X Y
R1 Keycol Hill 1.5 586912.88 164518.86
R2 Keycol Hill 1.5 586983.25 164518.02
R3 Keycol Hill 1.5 587115.88 164473.28
R4 Keycol Hill 1.5 587150.88 164480.88
6 Defra (2017). Emissions Factor Toolkit v9.0.
9438 AQMA Feasibility Study.docx Date: 20 April 2020 Page 7 of 20