
Page 33 - Live-cellanalysis handbook
P. 33
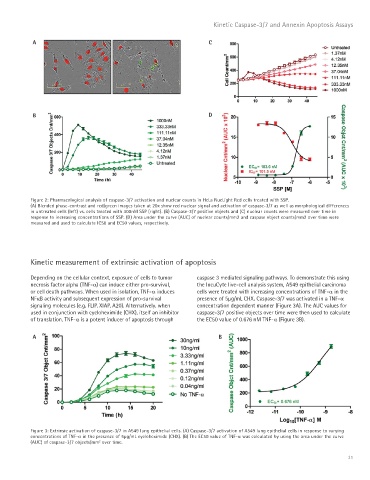
Kinetic Caspase-3/7 and Annexin Apoptosis Assays


            A                                                         C


            B                                                         D


           Figure 2: Pharmacological analysis of caspase-3/7 activation and nuclear counts in HeLa NucLight Red cells treated with SSP.
           (A) Blended phase-contrast and red/green images taken at 20x show red nuclear signal and activation of caspase-3/7 as well as morphological differences
           in untreated cells (left) vs. cells treated with 300nM SSP (right). (B) Caspase-3/7 positive objects and (C) nuclear counts were measured over time in
           response to increasing concentrations of SSP. (D) Area under the curve (AUC) of nuclear counts/mm2 and caspase object counts/mm2 over time were
           measured and used to calculate IC50 and EC50 values, respectively.


           Kinetic measurement of extrinsic activation of apoptosis

           Depending on the cellular context, exposure of cells to tumor   caspase 3 mediated signaling pathways. To demonstrate this using
           necrosis factor alpha (TNF-a) can induce either pro-survival,   the IncuCyte live-cell analysis system, A549 epithelial carcinoma
           or cell death pathways. When used in isolation, TNF-a induces   cells were treated with increasing concentrations of TNF-a in the
           NFκB activity and subsequent expression of pro-survival   presence of 5μg/mL CHX. Caspase-3/7 was activated in a TNF-a
           signaling molecules (e.g. FLIP, XIAP, A20). Alternatively, when   concentration dependent manner (Figure 3A). The AUC values for
           used in conjunction with cycloheximide (CHX), itself an inhibitor   caspase-3/7 positive objects over time were then used to calculate
           of translation, TNF-a is a potent inducer of apoptosis through   the EC50 value of 0.676 nM TNF-a (Figure 3B).


            A                                                            B


           Figure 3: Extrinsic activation of caspase-3/7 in A549 lung epithelial cells. (A) Caspase-3/7 activation of A549 lung epithelial cells in response to varying
           concentrations of TNF-a in the presence of 5μg/mL cycloheximide (CHX). (B) The EC50 value of TNF-a was calculated by using the area under the curve
                                  2
           (AUC) of caspase-3/7 objects/mm  over time.
                                                                                                                    31