
Page 32 - Live-cellanalysis handbook
P. 32
Live-Cell Analysis Handbook — Third Edition
Sample Results
Quantitative measurement of caspase-3/7 kinetic activation
MDA-MB-231 cells, a human breast adenocarcinoma derived cell A
line, were treated with staurosporine (SSP) a well-known inducer
of apoptosis. SSP was serially diluted in growth media containing 5
μM IncuCyte Caspase 3/7 reagent in a 96-well plate. Once treated,
the cells were immediately placed inside the IncuCyte live-cell
analysis system with a 10X objective in a standard cell culture
incubator and both phase-contrast and fluorescent images were
collected every 2-3 hours.
Alterations in cell morphology were evident within only a few B
hours of SSP treatment as illustrated in the phase image in
Figure 1A. Using fluorescent images, we positively identified cells
containing fluorescently stained DNA indicating activation of
caspase-3/7, cleavage of the DEVD moiety in the kinetic apoptosis
reagent, and fluorescent labeling of cellular DNA (green image in
Figure 1A). Using the object counting algorithm, we successfully
quantified the number of fluorescent objects , shown in Figure
1A. The object counting criteria were then applied to all images in
the experiment at each time point. The data in Figure 1B indicate
that caspase-3/7 activation is detectable within a few hours of SSP
treatment, with a maximal response triggered in the presence of
333 nM SSP.
Increasing concentrations of SSP also significantly affected cell C
proliferation. To demonstrate this on the IncuCyte, we completed
an end point analysis at the 48 hour time point. Vybrant®
DyeCycle™ Green DNA dye was added directly (no wash required)
to the wells at a final concentration of 1 μM in 50 μL of PBS.
After a 30 minute incubation, the total number of DNA containing
objects was enumerated using the object counting algorithm. As
expected, our data indicate an inverse correlation between the
total number of objects and the apoptotic index as a function
of increasing concentrations of SSP (Figure 1C). The data clearly
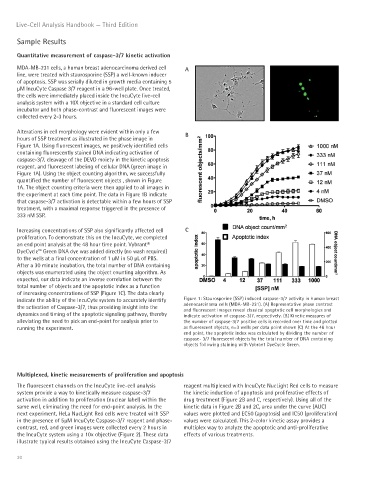
indicate the ability of the IncuCyte system to accurately identify Figure 1: Staurosporine (SSP) induced caspase-3/7 activity in human breast
the activation of Caspase-3/7, thus providing insight into the adenocarcinoma cells (MDA-MB-231). (A) Representative phase contrast
and fluorescent images reveal classical apoptotic cell morphologies and
dynamics and timing of the apoptotic signaling pathway, thereby indicate activation of caspase-3/7, respectively. (B) Kinetic measures of
alleviating the need to pick an end-point for analysis prior to the number of caspase-3/7 positive cells is recorded over time and plotted
running the experiment. as fluorescent objects, n=3 wells per data point shown (C) At the 48 hour
end point, the apoptotic index was calculated by dividing the number of
caspase- 3/7 fluorescent objects by the total number of DNA containing
objects following staining with Vybrant DyeCycle Green.
Multiplexed, kinetic measurements of proliferation and apoptosis
The fluorescent channels on the IncuCyte live-cell analysis reagent multiplexed with IncuCyte NucLight Red cells to measure
system provide a way to kinetically measure caspase-3/7 the kinetic induction of apoptosis and proliferative effects of
activation in addition to proliferation (nuclear label) within the drug treatment (Figure 2B and C, respectively). Using all of the
same well, eliminating the need for end-point analysis. In the kinetic data in Figure 2B and 2C, area under the curve (AUC)
next experiment, HeLa NucLight Red cells were treated with SSP values were plotted and EC50 (apoptosis) and IC50 (proliferation)
in the presence of 5μM IncuCyte Caspase-3/7 reagent and phase- values were calculated. This 2-color kinetic assay provides a
contrast, red, and green images were collected every 2 hours in multiplex way to analyze the apoptotic and anti-proliferative
the IncuCyte system using a 10x objective (Figure 2). These data effects of various treatments.
illustrate typical results obtained using the IncuCyte Caspase-3/7
30