
Page 34 - Live-cellanalysis handbook
P. 34
Live-Cell Analysis Handbook — Third Edition
Using images and movies to confirm signaling
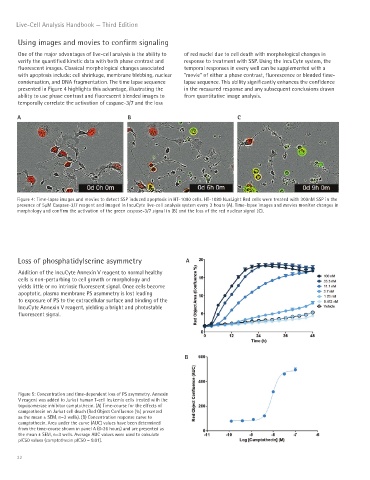
One of the major advantages of live-cell analysis is the ability to of red nuclei due to cell death with morphological changes in
verify the quantified kinetic data with both phase contrast and response to treatment with SSP. Using the IncuCyte system, the
fluorescent images. Classical morphological changes associated temporal responses in every well can be supplemented with a
with apoptosis include: cell shrinkage, membrane blebbing, nuclear “movie” of either a phase contrast, fluorescence or blended time-
condensation, and DNA fragmentation. The time lapse sequence lapse sequence. This ability significantly enhances the confidence
presented in Figure 4 highlights this advantage, illustrating the in the measured response and any subsequent conclusions drawn
ability to use phase contrast and fluorescent blended images to from quantitative image analysis.
temporally correlate the activation of caspase-3/7 and the loss
A B C
Figure 4: Time-lapse images and movies to detect SSP induced apoptosis in HT-1080 cells. HT-1080 NucLight Red cells were treated with 300nM SSP in the
presence of 5μM Caspase-3/7 reagent and imaged in IncuCyte live-cell analysis system every 3 hours (A). Time-lapse images and movies monitor changes in
morphology and confirm the activation of the green caspase-3/7 signal in (B) and the loss of the red nuclear signal (C).
Loss of phosphatidylserine asymmetry A
Addition of the IncuCyte Annexin V reagent to normal healthy
cells is non-perturbing to cell growth or morphology and
yields little or no intrinsic fluorescent signal. Once cells become
apoptotic, plasma membrane PS asymmetry is lost leading
to exposure of PS to the extracellular surface and binding of the
IncuCyte Annexin V reagent, yielding a bright and photostable
fluorescent signal.
B
Figure 5: Concentration and time-dependent loss of PS asymmetry. Annexin
V reagent was added to Jurkat human T-cell leukemia cells treated with the
topoisomerase inhibitor camptothecin. (A) Time-course for the effects of
camptothecin on Jurkat cell death (Red Object Confluence (%) presented
as the mean ± SEM, n=3 wells). (B) Concentration response curve to
camptothecin. Area under the curve (AUC) values have been determined
from the time-course shown in panel A (0-36 hours) and are presented as
the mean ± SEM, n=3 wells. Average AUC values were used to calculate
pIC50 values (camptothecin pIC50 = 8.01).
32