
Page 41 - Live-cellanalysis handbook
P. 41
Kinetic Cytotoxicity Assays
SSP CMP CHX Control
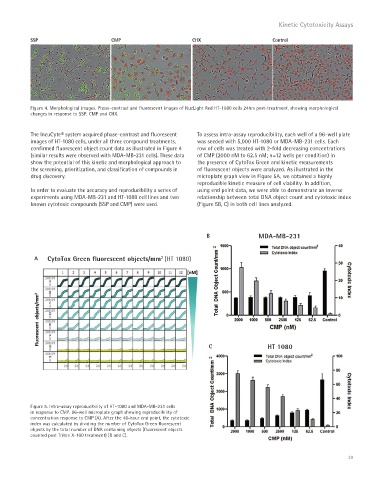
Figure 4. Morphological images. Phase-contrast and fluorescent images of NucLight Red HT-1080 cells 24hrs post-treatment, showing morphological
changes in response to SSP, CMP and CHX.
The IncuCyte® system acquired phase-contrast and fluorescent To assess intra-assay reproducibility, each well of a 96-well plate
images of HT-1080 cells, under all three compound treatments, was seeded with 5,000 HT-1080 or MDA-MB-231 cells. Each
confirmed fluorescent object count data as illustrated in Figure 4 row of cells was treated with 2-fold decreasing concentrations
(similar results were observed with MDA-MB-231 cells). These data of CMP (2000 nM to 62.5 nM; n=12 wells per condition) in
show the potential of this kinetic and morphological approach to the presence of CytoTox Green and kinetic measurements
the screening, prioritization, and classification of compounds in of fluorescent objects were analyzed. As illustrated in the
drug discovery. microplate graph view in Figure 5A, we obtained a highly
reproducible kinetic measure of cell viability. In addition,
In order to evaluate the accuracy and reproducibility a series of using end point data, we were able to demonstrate an inverse
experiments using MDA-MB-231 and HT-1080 cell lines and two relationship between total DNA object count and cytotoxic index
known cytotoxic compounds (SSP and CMP) were used. (Figure 5B, C) in both cell lines analyzed.
B MDA-MB-231
A CytoTox Green fluorescent objects/mm (HT 1080)
2
C HT 1080
Figure 5. Intra-assay reproducibility of HT-1080 and MDA-MB-231 cells
in response to CMP. 96-well microplate graph showing reproducibility of
concentration response to CMP (A). After the 48-hour end point, the cytotoxic
index was calculated by dividing the number of CytoTox Green fluorescent
objects by the total number of DNA containing objects (fluorescent objects
counted post Triton X-100 treatment) (B and C).
39