
Page 42 - Live-cellanalysis handbook
P. 42
Live-Cell Analysis Handbook — Third Edition
A C
B
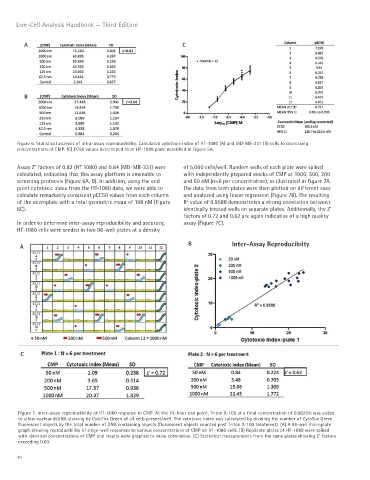
Figure 6. Statistical analysis of intra-assay reproducibility. Calculated cytotoxic index of HT-1080 (A) and MD-MB-231 (B) cells to decreasing
concentrations of CMP. (C) EC50 values determined from HT-1080 plate described in Figure 5A.
Assay Z’ factors of 0.82 (HT 1080) and 0.64 (MD-MB-231) were of 5,000 cells/well. Random wells of each plate were spiked
calculated, indicating that this assay platform is amenable to with independently prepared stocks of CMP at 1000, 500, 200
screening protocols (Figure 6A, B). In addition, using the end and 50 nM (n=6 per concentration), as illustrated in Figure 7A.
point cytotoxic index from the HT-1080 data, we were able to The data from both plates were then plotted on different axes
calculate remarkably consistent pEC50 values from each column and analyzed using linear regression (Figure 7B). The resulting
2
of the microplate with a total geometric mean of 198 nM (Figure R value of 0.9588 demonstrates a strong correlation between
6C). identically treated wells on separate plates. Additionally, the Z’
factors of 0.72 and 0.62 are again indicative of a high quality
In order to determine inter-assay reproducibility and accuracy, assay (Figure 7C).
HT-1080 cells were seeded in two 96-well plates at a density
B Inter-Assay Reproducibilty
A
C
Figure 7. Inter-assay reproducibility of HT-1080 response to CMP. At the 72-hour end point, Triton X-100 at a final concentration of 0.0625% was added
to allow nuclear dsDNA staining by CytoTox Green of all cells present/well. The cytotoxic index was calculated by dividing the number of CytoTox Green
fluorescent objects by the total number of DNA containing objects (fluorescent objects counted post Triton X-100 treatment). (A) A 96-well microplate
graph showing reproducibility of singe-well responses to various concentrations of CMP on HT-1080 cells. (B) Replicate plates of HT-1080 were spiked
with identical concentrations of CMP and results were graphed to show correlation. (C) Statistical measurements from the same plates showing Z’ factors
exceeding 0.60.
40