
Page 43 - Live-cellanalysis handbook
P. 43
Kinetic Cytotoxicity Assays
Differentiating cytotoxic and cytostatic treatments
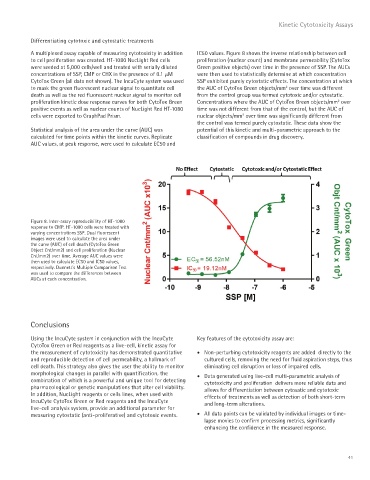
A multiplexed assay capable of measuring cytotoxicity in addition IC50 values. Figure 8 shows the inverse relationship between cell
to cell proliferation was created. HT-1080 NucLight Red cells proliferation (nuclear count) and membrane permeability (CytoTox
were seeded at 5,000 cells/well and treated with serially diluted Green positive objects) over time in the presence of SSP. The AUCs
concentrations of SSP, CMP or CHX in the presence of 0.1 μM were then used to statistically determine at which concentration
CytoTox Green (all data not shown). The IncuCyte system was used SSP exhibited purely cytostatic effects. The concentration at which
2
to mask the green fluorescent nuclear signal to quantitate cell the AUC of CytoTox Green objects/mm over time was different
death as well as the red fluorescent nuclear signal to monitor cell from the control group was termed cytotoxic and/or cytostatic.
2
proliferation kinetic dose response curves for both CytoTox Green Concentrations where the AUC of CytoTox Green objects/mm over
positive events as well as nuclear counts of NucLight Red HT-1080 time was not different from that of the control, but the AUC of
cells were exported to GraphPad Prism. nuclear objects/mm over time was significantly different from
2
the control was termed purely cytostatic. These data show the
Statistical analysis of the area under the curve (AUC) was potential of this kinetic and multi-parametric approach to the
calculated for time points within the kinetic curves. Replicate classification of compounds in drug discovery.
AUC values, at peak response, were used to calculate EC50 and
Figure 8. Inter-assay reproducibility of HT-1080
response to CMP. HT-1080 cells were treated with
varying concentrations SSP. Dual fluorescent
images were used to calculate the area under
the curve (AUC) of cell death (CytoTox Green
Object Cnt/mm2) and cell proliferation (Nuclear
Cnt/mm2) over time. Average AUC values were
then used to calculate EC50 and IC50 values,
respectively. Dunnett’s Multiple Comparison Test
was used to compare the differences between
AUCs at each concentration.
Conclusions
Using the IncuCyte system in conjunction with the IncuCyte Key features of the cytotoxicity assay are:
CytoTox Green or Red reagents as a live-cell, kinetic assay for
the measurement of cytotoxicity has demonstrated quantitative • Non-perturbing cytotoxicity reagents are added directly to the
and reproducible detection of cell permeability, a hallmark of cultured cells, removing the need for fluid aspiration steps, thus
cell death. This strategy also gives the user the ability to monitor eliminating cell disruption or loss of impaired cells.
morphological changes in parallel with quantification, the • Data generated using live-cell multi-parametric analysis of
combination of which is a powerful and unique tool for detecting cytotoxicity and proliferation delivers more reliable data and
pharmacological or genetic manipulations that alter cell viability. allows for differentiation between cytosatic and cytotoxic
In addition, NucLight reagents or cells lines, when used with effects of treatments as well as detection of both short-term
IncuCyte CytoTox Green or Red reagents and the IncuCyte and long-term alterations.
live-cell analysis system, provide an additional parameter for
measuring cytostatic (anti-proliferative) and cytotoxic events. • All data points can be validated by individual images or time-
lapse movies to confirm processing metrics, significantly
enhancing the confidence in the measured response.
41