
Page 40 - Live-cellanalysis handbook
P. 40
Live-Cell Analysis Handbook — Third Edition
In contrast, no statistical induction of cytotoxicity was (Figure 2). Moreover, end point normalization, which corrects for
observed when either cell type was treated with any of the differences in proliferation within treatment groups, revealed a
tested concentrations of CHX (Figure 1A, B). However, a clear concentration-dependent cytotoxic index for both SSP and CMP in
concentration-dependent inhibition of cell proliferation was MDA-MB-231 and HT-1080 cells, whereas no cytotoxic responses
observed as measured by the NucLight Red fluorescent signal was induced by treatment with CHX (Figure 3).
Membrane Permeability Proliferation
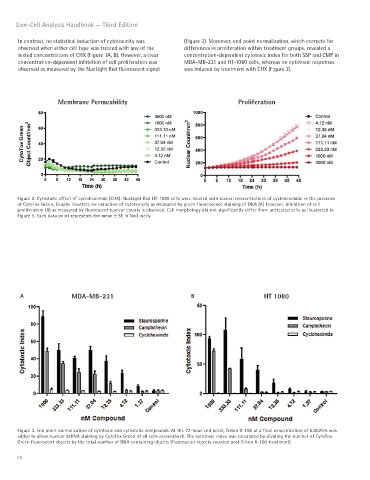
Figure 2. Cytostatic effect of cycloheximide (CHX). NucLight Red HT-1080 cells were treated with several concentrations of cycloheximide in the presence
of CytoTox Green. Graphs illustrate no induction of cytotoxicity as measured by green fluorescence staining of DNA (A) however, inhibition of cell
proliferation (B) as measured by fluorescent nuclear counts is observed. Cell morphology did not significantly differ from untreated cells as illustrated in
Figure 5. Each data point represents the mean ± SE in N=3 wells.
A MDA-MB-231 B HT 1080
Figure 3. End point normalization of cytotoxic and cytostatic compounds. At the 72-hour end point, Triton X-100 at a final concentration of 0.0625% was
added to allow nuclear dsDNA staining by CytoTox Green of all cells present/well. The cytotoxic index was calculated by dividing the number of CytoTox
Green fluorescent objects by the total number of DNA containing objects (fluorescent objects counted post Triton X-100 treatment).
38