
Page 1096 - The Toxicology of Fishes
P. 1096
(A) (B)
20 µm 20 µm
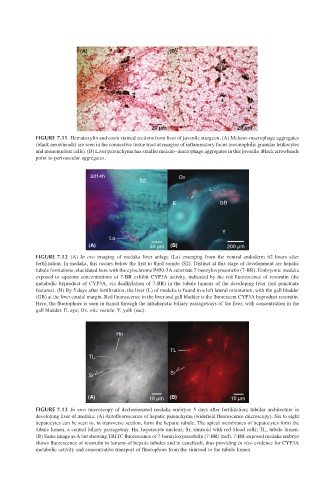
FIGURE 7.11 Hematoxylin and eosin stained sections from liver of juvenile sturgeon. (A) Melano–macrophage aggregates
(black arrowheads) are seen in the connective tissue tract at margins of inflammatory focus (eosinophilic granular leukocytes
and mononuclear cells). (B) Liver parenchyma has smaller melano–macrophage aggregates in this juvenile. Black arrowheads
point to perivascular aggregates.
2d14h Ov
S2
L
E GB
Y
La
(A) 50 µm (B) 200 µm
FIGURE 7.12 (A) In ovo imaging of medaka liver anlage (La) emerging from the ventral endoderm 62 hours after
fertilization. In medaka, this occurs below the first to third somite (S2). Distinct at this stage of development are hepatic
tubule formations, elucidated here with the cytochrome P450-3A substrate 7-benzyloxyresorufin (7-BR). Embryonic medaka
exposed to aqueous concentrations of 7-BR exhibit CYP3A activity, indicated by the red fluorescence of resorufin (the
metabolic byproduct of CYP3A, via dealkylation of 7-BR) in the tubule lumens of the developing liver (red punctuate
features). (B) By 5 days after fertilization, the liver (L) of medaka is found in a left lateral orientation, with the gall bladder
(GB) at the liver caudal margin. Red fluorescence in the liver and gall bladder is the fluorescent CYP3A byproduct resorufin.
Here, the fluorophore is seen in transit through the intrahepatic biliary passageways of the liver, with concentration in the
gall bladder. E, eye; Ov, otic vesicle; Y, yolk (sac).
Hn
TL
TL
Sr
Sr
(A) 10 µm (B) 10 µm
FIGURE 7.13 In vivo microscopy of dechorionated medaka embryos 5 days after fertilization; tubular architecture in
developing liver of medaka. (A) Autofluorescence of hepatic parenchyma (widefield fluorescence microscopy). Six to eight
hepatocytes can be seen to, in transverse section, form the hepatic tubule. The apical membranes of hepatocytes form the
tubule lumen, a central biliary passageway. Hn, hepatocyte nucleus; Sr, sinusoid with red blood cells; TL, tubule lumen.
(B) Same image as A but showing TRITC fluorescence of 7-benzyloxyresofufin (7-BR) (red). 7-BR-exposed medaka embryo
shows fluorescence of resorufin in lumens of hepatic tubules and in canaliculi, thus providing in vivo evidence for CYP3A
metabolic activity and concentrative transport of fluorophore from the sinusoid to the tubule lumen.