
Page 353 - The Toxicology of Fishes
P. 353
Liver Toxicity 333
(A)
S
0.5 cm
(B) GB
S
Gt
0.5 cm
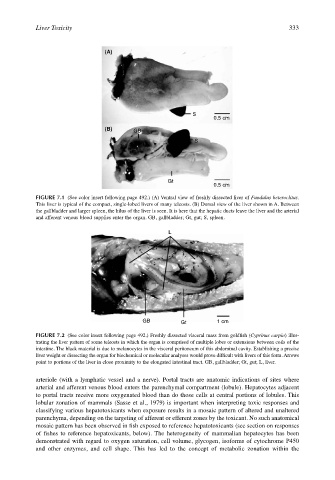
FIGURE 7.1 (See color insert following page 492.) (A) Ventral view of freshly dissected liver of Fundulus heteroclitus.
This liver is typical of the compact, single-lobed livers of many teleosts. (B) Dorsal view of the liver shown in A. Between
the gallbladder and larger spleen, the hilus of the liver is seen. It is here that the hepatic ducts leave the liver and the arterial
and afferent venous blood supplies enter the organ. GB, gallbladder; Gt, gut; S, spleen.
L
GB Gt 1 cm
FIGURE 7.2 (See color insert following page 492.) Freshly dissected visceral mass from goldfish (Cyprinus carpio) illus-
trating the liver pattern of some teleosts in which the organ is comprised of multiple lobes or extensions between coils of the
intestine. The black material is due to melanocytes in the visceral peritoneum of this abdominal cavity. Establishing a precise
liver weight or dissecting the organ for biochemical or molecular analyses would prove difficult with livers of this form. Arrows
point to portions of the liver in close proximity to the elongated intestinal tract. GB, gallbladder; Gt, gut; L, liver.
arteriole (with a lymphatic vessel and a nerve). Portal tracts are anatomic indications of sites where
arterial and afferent venous blood enters the parenchymal compartment (lobule). Hepatocytes adjacent
to portal tracts receive more oxygenated blood than do those cells at central portions of lobules. This
lobular zonation of mammals (Sasse et al., 1979) is important when interpreting toxic responses and
classifying various hepatotoxicants when exposure results in a mosaic pattern of altered and unaltered
parenchyma, depending on the targeting of afferent or efferent zones by the toxicant. No such anatomical
mosaic pattern has been observed in fish exposed to reference hepatotoxicants (see section on responses
of fishes to reference hepatoxicants, below). The heterogeneity of mammalian hepatocytes has been
demonstrated with regard to oxygen saturation, cell volume, glycogen, isoforms of cytochrome P450
and other enzymes, and cell shape. This has led to the concept of metabolic zonation within the