
Page 357 - The Toxicology of Fishes
P. 357
Liver Toxicity 337
TABLE 7.2
Intrahepatocyte Organelle Distribution
Rat, Standard Diet a Rat, Fructose Diet a Carp, Standard Diet b
Endoplasmic Endoplasmic Endoplasmic
Mitochondria Reticulum Mitochondria Reticulum Mitochondria Reticulum
Zone (%) (%) (%) (%) (%) (%)
A 45 54 49 77 68 71
B 28 23 21 12 15 10
C 27 23 30 11 17 19
a Data from Riede, U.N. and Sasse, D., Cell Tissue Res., 221(1), 209–220, 1981.
b Data from Senger (unpublished).
Note: The numbers indicate organelle distribution along a virtual axis from the cell nucleus to the cell periphery.
The axis was subdivided into three zones: a perinuclear zone (A), a middle zone (B), and a peripheral zone (C).
Nonhepatocyte Cells of the Liver
It is important to note that liver toxicity is not always the straightforward consequence of toxic impact
on hepatocytes, as nonhepatocytes or interactions between hepatocytes and other liver cells can also be
key players in the toxic response of the organ.
Biliary Epithelial Cells and the Intrahepatic Biliary System
The biliary system begins with the hepatocytes that are responsible for the uptake of xenobiotics and
potentially toxic byproducts of metabolism. Briefly, hepatocytes form water-soluble conjugates that are
transported across the plasma membrane into specialized passageways, the canaliculi (Figure 7.6), which
are formed solely by junctional complexes between plasma membranes of hepatocytes. The canalicular
lumen is delimited by tight junctional complexes (between the membranes of mammalian hepatocytes)
that permit the paracellular exchange of solutes (ions and salts) between blood plasma and the canalicular
lumen (Arias et al., 1988). Normal lumina of fish canaliculi (like their mammalian counterparts) are
nearly completely filled by hepatocyte microvillar processes (Braunbeck et al., 1992; Hampton et al.,
1985; Rocha et al., 1997). Intrahepatic bile passageways (IHBPs) are comprised of bile canaliculi (see
Figure 7.6 and Figure 7.8) and bile ductules (cholangioles). In addition, morphological studies of normal
BPD
BPDC
(A) 2 µm (B) 10 µm
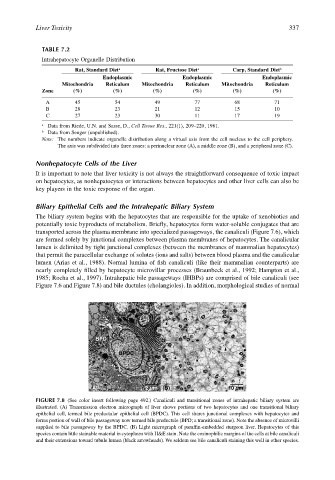
FIGURE 7.8 (See color insert following page 492.) Canaliculi and transitional zones of intrahepatic biliary system are
illustrated. (A) Transmission electron micrograph of liver shows portions of two hepatocytes and one transitional biliary
epithelial cell, termed bile preductular epithelial cell (BPDC). This cell shares junctional complexes with hepatocytes and
forms portion of wall of bile passageway now termed bile preductule (BPD; a transitional zone). Note the absence of microvilli
supplied to bile passageway by the BPDC. (B) Light micrograph of paraffin-embedded sturgeon liver. Hepatocytes of this
species contain little stainable material in cytoplasm with H&E stain. Note the eosinophilic margins of the cells at bile canaliculi
and their extensions toward tubule lumen (black arrowheads). We seldom see bile canaliculi staining this well in other species.