
Page 359 - The Toxicology of Fishes
P. 359
Liver Toxicity 339
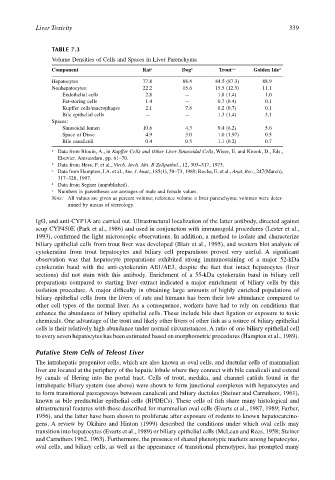
TABLE 7.3
Volume Densities of Cells and Spaces in Liver Parenchyma
Component Rat a Dog b Trout c,e Golden Ide d
Hepatocytes 77.8 88.4 84.5 (87.3) 88.9
Nonhepatocytes: 22.2 15.6 15.5 (12.3) 11.1
Endothelial cells 2.8 — 1.8 (1.4) 1.0
Fat-storing cells 1.4 — 0.7 (0.4) 0.1
Kupffer cells/macrophages 2.1 7.8 0.2 (0.7) 0.1
Bile epithelial cells — — 1.3 (1.4) 3.1
Spaces:
Sinusoidal lumen 10.6 4.3 9.4 (6.2) 5.6
Space of Disse 4.9 3.0 1.0 (1.97) 0.5
Bile canaliculi 0.4 0.5 1.1 (0.2) 0.7
a Data from Blouin, A., in Kupffer Cells and Other Liver Sinusoidal Cells, Wisse, E. and Knook, D., Eds.,
Elsevier, Amsterdam, pp. 61–70.
b Data from Hess, F. et al., Virch. Arch. Abt. B Zellpathol., 12, 303–317, 1973.
c Data from Hampton, J.A. et al., Am. J. Anat., 185(1), 58–73, 1989; Rocha, E. et al., Anat. Rec., 247(March),
317–328, 1997.
d Data from Segner (unpublished).
e Numbers in parentheses are averages of male and female values.
Note: All values are given as percent volume; reference volume = liver parenchyma; volumes were deter-
mined by means of stereology.
IgG, and anti-CYP1A are carried out. Ultrastructural localization of the latter antibody, directed against
scup CYP450E (Park et al., 1986) and used in conjunction with immunogold procedures (Lester et al.,
1993), confirmed the light microscopic observations. In addition, a method to isolate and characterize
biliary epithelial cells from trout liver was developed (Blair et al., 1995), and western blot analysis of
cytokeratins from trout hepatocytes and biliary cell preparations proved very useful. A significant
observation was that hepatocyte preparations exhibited strong immunostaining of a major 52-kDa
cytokeratin band with the anti-cytokeratin AE1/AE3, despite the fact that intact hepatocytes (liver
sections) did not stain with this antibody. Enrichment of a 55-kDa cytokeratin band in biliary cell
preparations compared to starting liver extract indicated a major enrichment of biliary cells by this
isolation procedure. A major difficulty in obtaining large amounts of highly enriched populations of
biliary epithelial cells from the livers of rats and humans has been their low abundance compared to
other cell types of the normal liver. As a consequence, workers have had to rely on conditions that
enhance the abundance of biliary epithelial cells. These include bile duct ligation or exposure to toxic
chemicals. One advantage of the trout and likely other livers of other fish as a source of biliary epithelial
cells is their relatively high abundance under normal circumstances. A ratio of one biliary epithelial cell
to every seven hepatocytes has been estimated based on morphometric procedures (Hampton et al., 1989).
Putative Stem Cells of Teleost Liver
The intrahepatic progenitor cells, which are also known as oval cells, and ductular cells of mammalian
liver are located at the periphery of the hepatic lobule where they connect with bile canaliculi and extend
by canals of Hering into the portal tract. Cells of trout, medaka, and channel catfish found in the
intrahepatic biliary system (see above) were shown to form junctional complexes with hepatocytes and
to form transitional passageways between canaliculi and biliary ductules (Steiner and Carruthers, 1961),
known as bile preductular epithelial cells (BPDECs). These cells of fish share many histological and
ultrastructural features with those described for mammalian oval cells (Evarts et al., 1987, 1989; Farber,
1956), and the latter have been shown to proliferate after exposure of rodents to known hepatocarcino-
gens. A review by Okihiro and Hinton (1999) described the conditions under which oval cells may
transition into hepatocytes (Evarts et al., 1989) or biliary epithelial cells (McLean and Rees, 1958; Steiner
and Carruthers 1962, 1963). Furthermore, the presence of shared phenotypic markers among hepatocytes,
oval cells, and biliary cells, as well as the appearance of transitional phenotypes, has prompted many