
Page 675 - The Toxicology of Fishes
P. 675
Exposure Assessment and Modeling in the Aquatic Environment 655
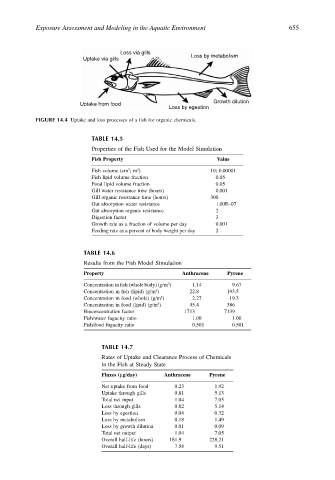
Loss via gills
Uptake via gills Loss by metabolism
Growth dilution
Uptake from food
Loss by egestion
FIGURE 14.4 Uptake and loss processes of a fish for organic chemicals.
TABLE 14.5
Properties of the Fish Used for the Model Simulation
Fish Property Value
3
3
Fish volume (cm ; m ) 10; 0.00001
Fish lipid volume fraction 0.05
Food lipid volume fraction 0.05
Gill water resistance time (hours) 0.001
Gill organic resistance time (hours) 300
Gut absorption water resistance 1.00E–07
Gut absorption organic resistance 2
Digestion factor 3
Growth rate as a fraction of volume per day 0.001
Feeding rate as a percent of body weight per day 2
TABLE 14.6
Results from the Fish Model Simulation
Property Anthracene Pyrene
Concentration in fish (whole body) (g/m ) 1.14 9.67
3
3
Concentration in fish (lipid) (g/m ) 22.8 193.5
Concentration in food (whole) (g/m ) 2.27 19.3
3
Concentration in food (lipid) (g/m ) 45.4 386
3
Bioconcentration factor 1713 7139
Fish/water fugacity ratio 1.00 1.00
Fish/food fugacity ratio 0.501 0.501
TABLE 14.7
Rates of Uptake and Clearance Process of Chemicals
in the Fish at Steady State
Fluxes (µg/day) Anthracene Pyrene
Net uptake from food 0.23 1.92
Uptake through gills 0.81 5.13
Total net input 1.04 7.05
Loss through gills 0.82 5.14
Loss by egestion 0.04 0.32
Loss by metabolism 0.18 1.49
Loss by growth dilution 0.01 0.09
Total net output 1.04 7.05
Overall half-life (hours) 181.9 228.21
Overall half-life (days) 7.58 9.51