
Page 672 - The Toxicology of Fishes
P. 672
652 The Toxicology of Fishes
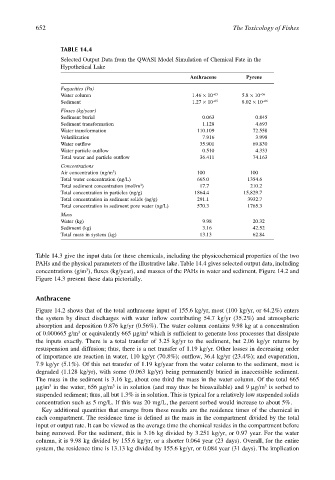
TABLE 14.4
Selected Output Data from the QWASI Model Simulation of Chemical Fate in the
Hypothetical Lake
Anthracene Pyrene
Fugacities (Pa)
Water column 1.46 × 10 –05 5.8 × 10 –06
Sediment 1.27 × 10 –05 8.02 × 10 –06
Fluxes (kg/year)
Sediment burial 0.063 0.845
Sediment transformation 1.128 4.693
Water transformation 110.109 72.558
Volatilization 7.916 3.998
Water outflow 35.901 69.830
Water particle outflow 0.510 4.333
Total water and particle outflow 36.411 74.163
Concentrations
3
Air concentration (ng/m ) 100 100
Total water concentration (ng/L) 665.0 1354.6
3
Total sediment concentration (mol/m ) 17.7 210.2
Total concentration in particles (ng/g) 1864.4 15,829.7
Total concentration in sediment solids (ng/g) 291.1 3932.7
Total concentration in sediment pore water (ng/L) 570.3 1765.3
Mass
Water (kg) 9.98 20.32
Sediment (kg) 3.16 42.52
Total mass in system (kg) 13.13 62.84
Table 14.3 give the input data for these chemicals, including the physicochemical properties of the two
PAHs and the physical parameters of the illustrative lake. Table 14.4 gives selected output data, including
3
concentrations (g/m ), fluxes (kg/year), and masses of the PAHs in water and sediment. Figure 14.2 and
Figure 14.3 present these data pictorially.
Anthracene
Figure 14.2 shows that of the total anthracene input of 155.6 kg/yr, most (100 kg/yr, or 64.2%) enters
the system by direct discharges with water inflow contributing 54.7 kg/yr (35.2%) and atmospheric
absorption and deposition 0.876 kg/yr (0.56%). The water column contains 9.98 kg at a concentration
3
3
of 0.000665 g/m or equivalently 665 µg/m which is sufficient to generate loss processes that dissipate
the inputs exactly. There is a total transfer of 3.25 kg/yr to the sediment, but 2.06 kg/yr returns by
resuspension and diffusion; thus, there is a net transfer of 1.19 kg/yr. Other losses in decreasing order
of importance are reaction in water, 110 kg/yr (70.8%); outflow, 36.4 kg/yr (23.4%); and evaporation,
7.9 kg/yr (5.1%). Of this net transfer of 1.19 kg/year from the water column to the sediment, most is
degraded (1.128 kg/yr), with some (0.063 kg/yr) being permanently buried in inaccessible sediment.
The mass in the sediment is 3.16 kg, about one third the mass in the water column. Of the total 665
µg/m in the water, 656 µg/m is in solution (and may thus be bioavailable) and 9 µg/m is sorbed to
3
3
3
suspended sediment; thus, all but 1.3% is in solution. This is typical for a relatively low suspended solids
concentration such as 5 mg/L. If this was 20 mg/L, the percent sorbed would increase to about 5%.
Key additional quantities that emerge from these results are the residence times of the chemical in
each compartment. The residence time is defined as the mass in the compartment divided by the total
input or output rate. It can be viewed as the average time the chemical resides in the compartment before
being removed. For the sediment, this is 3.16 kg divided by 3.251 kg/yr, or 0.97 year. For the water
column, it is 9.98 kg divided by 155.6 kg/yr, or a shorter 0.064 year (23 days). Overall, for the entire
system, the residence time is 13.13 kg divided by 155.6 kg/yr, or 0.084 year (31 days). The implication