
Page 481 - Veterinary Toxicology, Basic and Clinical Principles, 3rd Edition
P. 481
448 SECTION | V Metals and Micronutrients
VetBooks.ir of the ΔΨ m results in colloid osmotic swelling of the oxidative damage, Mn exposure also induced an increase
in biomarkers of inflammation, prostaglandin E 2 (PGE 2 ),
mitochondria matrix, movement of metabolites across the
in vitro and in vivo (Milatovic et al., 2007, 2009). Results
inner membrane, defective oxidative phosphorylation,
cessation of ATP synthesis and further generation of ROS. from an in vivo study showed that Mn exposure induced a
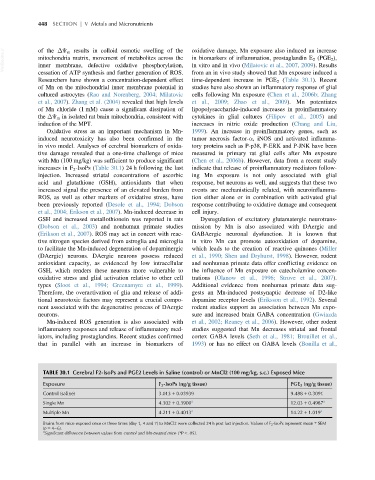
Researchers have shown a concentration-dependent effect time-dependent increase in PGE 2 (Table 30.1). Recent
of Mn on the mitochondrial inner membrane potential in studies have also shown an inflammatory response of glial
cultured astrocytes (Rao and Norenberg, 2004; Milatovic cells following Mn exposure (Chen et al., 2006b; Zhang
et al., 2007). Zhang et al. (2004) revealed that high levels et al., 2009; Zhao et al., 2009). Mn potentiates
of Mn chloride (1 mM) cause a significant dissipation of lipopolysaccharide-induced increases in proinflammatory
the ΔΨ m in isolated rat brain mitochondria, consistent with cytokines in glial cultures (Filipov et al., 2005) and
induction of the MPT. increases in nitric oxide production (Chang and Liu,
Oxidative stress as an important mechanism in Mn- 1999). An increase in proinflammatory genes, such as
induced neurotoxicity has also been confirmed in the tumor necrosis factor-α, iNOS and activated inflamma-
in vivo model. Analyses of cerebral biomarkers of oxida- tory proteins such as P-p38, P-ERK and P-JNK have been
tive damage revealed that a one-time challenge of mice measured in primary rat glial cells after Mn exposure
with Mn (100 mg/kg) was sufficient to produce significant (Chen et al., 2006b). However, data from a recent study
increases in F 2 -IsoPs (Table 30.1) 24 h following the last indicate that release of proinflammatory mediators follow-
injection. Increased striatal concentrations of ascorbic ing Mn exposure is not only associated with glial
acid and glutathione (GSH), antioxidants that when response, but neurons as well, and suggests that these two
increased signal the presence of an elevated burden from events are mechanistically related, with neuroinflamma-
ROS, as well as other markers of oxidative stress, have tion either alone or in combination with activated glial
been previously reported (Desole et al., 1994; Dobson response contributing to oxidative damage and consequent
et al., 2004; Erikson et al., 2007). Mn-induced decrease in cell injury.
GSH and increased metallothionein was reported in rats Dysregulation of excitatory glutamatergic neurotrans-
(Dobson et al., 2003) and nonhuman primate studies mission by Mn is also associated with DAergic and
(Erikson et al., 2007). ROS may act in concert with reac- GABAergic neuronal dysfunction. It is known that
tive nitrogen species derived from astroglia and microglia in vitro Mn can promote autooxidation of dopamine,
to facilitate the Mn-induced degeneration of dopaminergic which leads to the creation of reactive quinones (Miller
(DAergic) neurons. DAergic neurons possess reduced et al., 1990; Shen and Dryhurst, 1998). However, rodent
antioxidant capacity, as evidenced by low intracellular and nonhuman primate data offer conflicting evidence on
GSH, which renders these neurons more vulnerable to the influence of Mn exposure on catecholamine concen-
oxidative stress and glial activation relative to other cell trations (Olanow et al., 1996; Struve et al., 2007).
types (Sloot et al., 1994; Greenamyre et al., 1999). Additional evidence from nonhuman primate data sug-
Therefore, the overactivation of glia and release of addi- gests an Mn-induced postsynaptic decrease of D2-like
tional neurotoxic factors may represent a crucial compo- dopamine receptor levels (Eriksson et al., 1992). Several
nent associated with the degenerative process of DAergic rodent studies support an association between Mn expo-
neurons. sure and increased brain GABA concentration (Gwiazda
Mn-induced ROS generation is also associated with et al., 2002; Reaney et al., 2006). However, other rodent
inflammatory responses and release of inflammatory med- studies suggested that Mn decreases striatal and frontal
iators, including prostaglandins. Recent studies confirmed cortex GABA levels (Seth et al., 1981; Brouillet et al.,
that in parallel with an increase in biomarkers of 1993) or has no effect on GABA levels (Bonilla et al.,
TABLE 30.1 Cerebral F2-IsoPs and PGE2 Levels in Saline (control) or MnCl2 (100 mg/kg, s.c.) Exposed Mice
Exposure F 2 -IsoPs (ng/g tissue) PGE 2 (ng/g tissue)
Control (saline) 3.013 1 0.03939 9.488 1 0.3091
Single Mn 4.302 1 0.3900 a 12.03 1 0.4987 a
Multiple Mn 4.211 1 0.4013 a 14.22 1 1.019 a
Brains from mice exposed once or three times (day 1, 4 and 7) to MnCl2 were collected 24 h post last injection. Values of F 2 -IsoPs represent mean 6 SEM
(n 5 4 6).
a
Significant difference between values from control and Mn-treated mice (*P , .05).