
Page 17 - Portfolio Analysis
P. 17
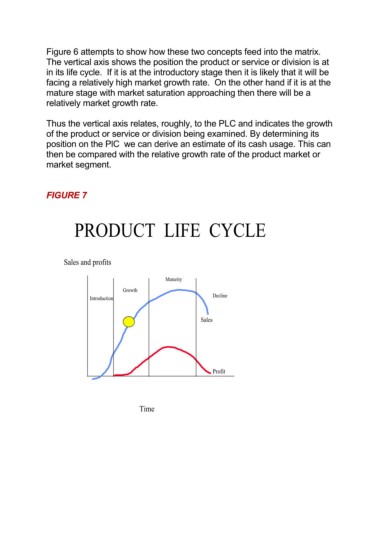
Figure 6 attempts to show how these two concepts feed into the matrix.
               The vertical axis shows the position the product or service or division is at
               in its life cycle.  If it is at the introductory stage then it is likely that it will be
               facing a relatively high market growth rate.  On the other hand if it is at the
               mature stage with market saturation approaching then there will be a
               relatively market growth rate.

               Thus the vertical axis relates, roughly, to the PLC and indicates the growth
               of the product or service or division being examined. By determining its
               position on the PlC  we can derive an estimate of its cash usage. This can
               then be compared with the relative growth rate of the product market or
               market segment.


               FIGURE 7


                        PRODUCT  LIFE  CYCLE


                     Sales and profits


                                                     Maturity
                                       Growth
                             Introduction                           Decline


                                                                Sales


                                                                    Profit


                                             Time