
Page 18 - Portfolio Analysis
P. 18
High
Market Product position
Relatively high cash
Growth usage but potential
Rate Cash Use high market growth
Low
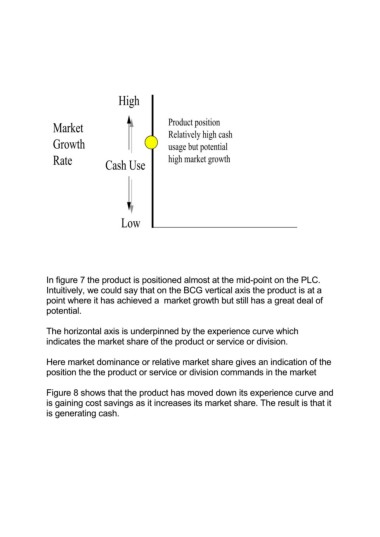
In figure 7 the product is positioned almost at the mid-point on the PLC.
Intuitively, we could say that on the BCG vertical axis the product is at a
point where it has achieved a market growth but still has a great deal of
potential.
The horizontal axis is underpinned by the experience curve which
indicates the market share of the product or service or division.
Here market dominance or relative market share gives an indication of the
position the the product or service or division commands in the market
Figure 8 shows that the product has moved down its experience curve and
is gaining cost savings as it increases its market share. The result is that it
is generating cash.