
Page 21 - Portfolio Analysis
P. 21
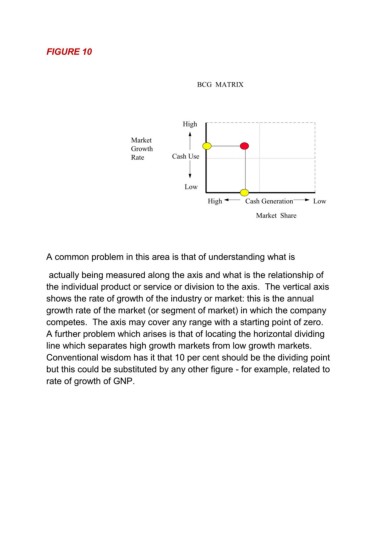
FIGURE 10


                                                               BCG  MATRIX


                                                          High

                                          Market
                                          Growth
                                          Rate         Cash Use


                                                           Low

                                                                  High        Cash Generation      Low
                                                                                 Market  Share


               A common problem in this area is that of understanding what is


                actually being measured along the axis and what is the relationship of
               the individual product or service or division to the axis.  The vertical axis

               shows the rate of growth of the industry or market: this is the annual
               growth rate of the market (or segment of market) in which the company
               competes.  The axis may cover any range with a starting point of zero.
               A further problem which arises is that of locating the horizontal dividing

               line which separates high growth markets from low growth markets.
               Conventional wisdom has it that 10 per cent should be the dividing point
               but this could be substituted by any other figure - for example, related to

               rate of growth of GNP.