
Page 20 - Portfolio Analysis
P. 20
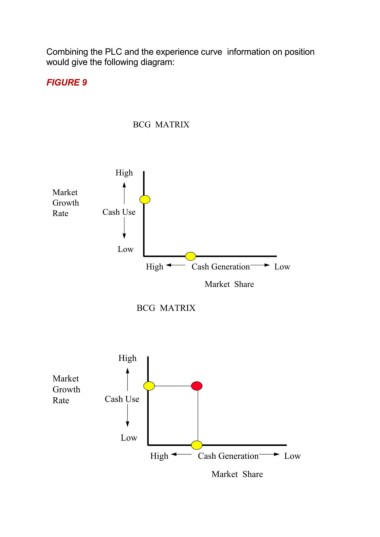
Combining the PLC and the experience curve  information on position
               would give the following diagram:

               FIGURE 9


                                           BCG  MATRIX


                                     High


                 Market
                 Growth
                 Rate            Cash Use


                                      Low

                                               High          Cash Generation           Low


                                                                 Market  Share

                                            BCG  MATRIX


                                      High


                 Market
                 Growth

                 Rate             Cash Use


                                       Low

                                                High           Cash Generation            Low


                                                                   Market  Share