Page 41 - Guardian Broker Questionnaire Summary Complete Package 2 2 22_Neat
P. 41

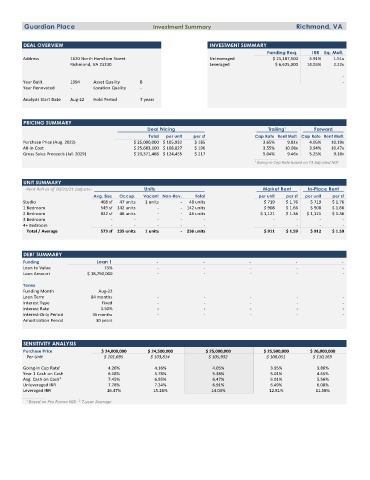
Guardian Place                              Investment Summary                            Richmond, VA


         DEAL OVERVIEW                                                 INVESTMENT SUMMARY
                                                                                          Funding Req.   IRR   Eq. Mult.
         Address         1620 North Hamilton Street                    Unleveraged         $ 25,187,500  6.91%  1.51x
                         Richmond, VA 23230                            Leveraged            $ 6,625,000  14.03%  2.22x

                                                                                                                  -
         Year Built      1994    Asset Quality   B                                                                -
         Year Renovated  -       Location Quality  -
         Analysis Start Date   Aug-22   Hold Period  7 years


         PRICING SUMMARY
                                                  Deal Pricing                            Trailing¹      Forward
                                                   Total   per unit   per sf          Cap Rate  Rent Mult.  Cap Rate  Rent Mult.
         Purchase Price (Aug. 2022)          $ 25,000,000  $ 105,932  $ 185             3.65%   9.81x  4.05%   10.19x
         All-in Cost                         $ 25,683,100  $ 108,827  $ 190             3.55%  10.08x  3.94%   10.47x
         Gross Sales Proceeds (Jul. 2029)    $ 29,371,468  $ 124,455  $ 217             5.04%   9.46x  5.25%   9.18x
                                                                                     ¹ Going-in Cap Rate based on T3 Adjusted NOI


         UNIT SUMMARY
          Rent Roll as of 10/31/21 (adjusted     Units                                  Market Rent    In-Place Rent
                                 Avg. Size   Occup.   Vacant  Non-Rev.   Total         per unit   per sf   per unit   per sf
         Studio                   408 sf  47 units  1 units  -  48 units                $ 719   $ 1.76  $ 719  $ 1.76
         1 Bedroom                549 sf  142 units  -       -  142 units               $ 908   $ 1.66  $ 908  $ 1.66
         2 Bedroom                822 sf  46 units   -       -  46 units               $ 1,121  $ 1.36  $ 1,121  $ 1.36
         3 Bedroom                    -      -       -       -      -                      -       -       -      -
         4+ Bedroom                   -      -       -       -      -                      -       -       -      -
          Total / Average         573 sf  235 units  1 units  -  236 units              $ 911   $ 1.59  $ 912  $ 1.59


         DEBT SUMMARY
         Funding                  Loan 1             -              -              -               -              -
         Loan to Value              75%              -              -               -              -              -
         Loan Amount          $ 18,750,000           -              -               -              -              -
         Terms
         Funding Month            Aug-22
         Loan Term             84 months             -              -               -              -              -
         Interest Type             Fixed             -              -               -              -              -
         Interest Rate            3.50%              -              -               -              -              -
         Interest-Only Period   36 months            -              -               -              -              -
         Amortization Period     30 years


         SENSITIVITY ANALYSIS
         Purchase Price            $ 24,000,000   $ 24,500,000       $ 25,000,000       $ 25,500,000    $ 26,000,000
          Per Unit                 $ 101,695       $ 103,814          $ 105,932          $ 108,051       $ 110,169
         Going-In Cap Rate¹          4.26%          4.16%              4.05%              3.95%           3.86%
         Year 1 Cash on Cash         6.18%          5.78%              5.38%              5.01%           4.65%
         Avg. Cash on Cash²          7.45%          6.95%              6.47%              6.01%           5.56%
         Unleveraged IRR             7.78%          7.34%              6.91%              6.49%           6.08%
         Leveraged IRR              16.47%          15.26%             14.03%             12.81%         11.58%
          ¹ Based on Pro Forma NOI  ² 7-year Average
   36   37   38   39   40   41   42   43   44   45   46